
The Cost of Poor Quality (COPQ) is also known as the cost of waste and it represents the costs that are incurred by the business or organization due to poor quality and defects in an existing process.
While many people tend to associate the Cost of Poor Quality (COPQ) to the Lean six sigma, the Cost of Poor Quality (COPQ) is actually a tool in six sigma that is frequently used to evaluate potential projects as well as yo prioritize the order they should be conducted.
While many people tend to associate the Cost of Poor Quality (COPQ) to the Lean six sigma, the Cost of Poor Quality (COPQ) is actually a tool in six sigma that is frequently used to evaluate potential projects as well as yo prioritize the order they should be conducted.
One of the things that you need to keep in mind about the Cost of Poor Quality (COPQ) is that it is a very effective way of identifying non-value. So, when you use it, it will be a lot easier to eliminate those activities and to generate cost savings.
Notice that the Cost of Poor Quality (COPQ) is not an exact science. After all, it's not possible to accurately measure them before you begin with the implementation of six sigma.
Notice that the Cost of Poor Quality (COPQ) is not an exact science. After all, it's not possible to accurately measure them before you begin with the implementation of six sigma.
The Goal Of Cost of Poor Quality (COPQ) Analysis
Simply put, the Cost of Poor Quality (COPQ) is an estimation tool and it should always be seen this way. This tool can help you identify lean six sigma projects, determine their financial viability, and even set priorities among potential projects.
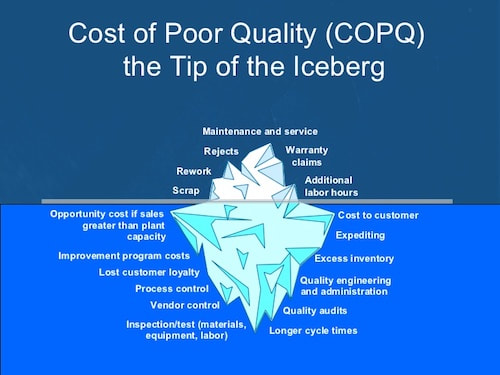
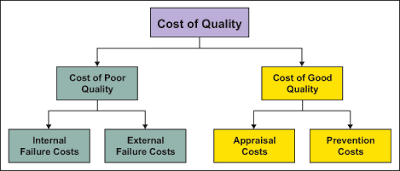
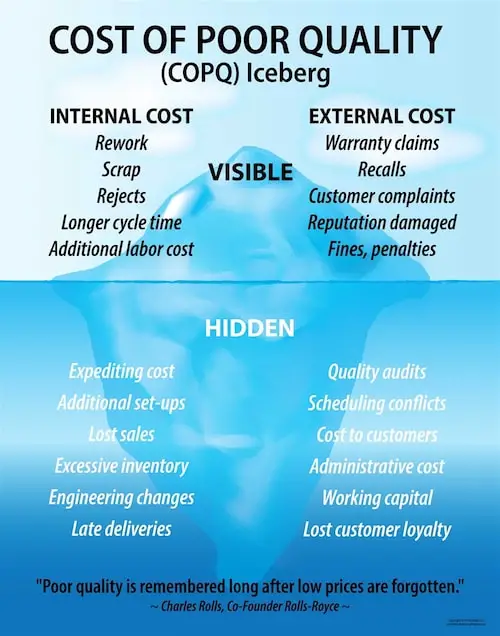
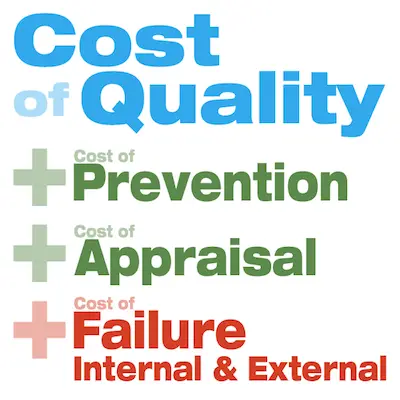
The main goal of the Cost of Poor Quality (COPQ) is to determine the financial costs of poor quality or waste that exist in a process. These costs tend to be referred to as failure costs and they can be divided into 4 categories:
The main goal of the Cost of Poor Quality (COPQ) is to determine the financial costs of poor quality or waste that exist in a process. These costs tend to be referred to as failure costs and they can be divided into 4 categories:
- Internal Failure Costs
- External Failure Costs
- Appraisal Costs
- Prevention Costs
#1: Internal Failure Costs:
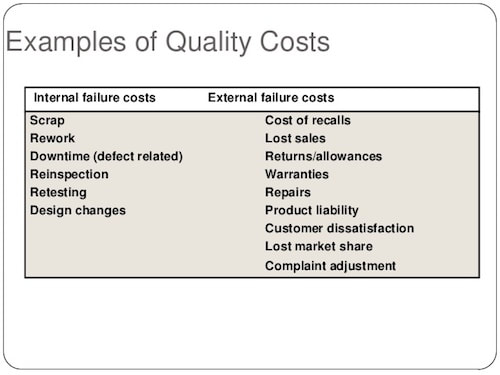
These are the costs that are incurred by a business or organization due to defects that are found before the service or product reaches the customer. You can classify as internal failure costs the following:
- Rework: These are the activities that are needed to correct the defects that were found.
- Scrap: This is the material that is seen as waste because it wasn't maximized.
- Failure Analysis: These costs include the time and effort that are needed to analyze the defective products or services.
- Re-Inspection And Re-Testing: As soon as you correct the errors or defects, the products or services will need to be tested and inspected to ensure they were properly corrected.
#2: External Failure Costs:
This category includes the costs that are incurred by a business due to defective services or products. The main difference with the previous category is that these errors or defects are found after the service or product reaches the customer. Some examples include:
- Adjustments For Complaints: Addition of added value service or items as a way to resolve customer complaints.
- Warranty Charges: These are the costs that a business has for honoring the warranty that was offered with the service or product.
- Allowances: These are usually given to distributors as credits against defective services or products.
- Returns: These are the costs that are linked to the returns or refunds as well as all the labor costs involved in the process.
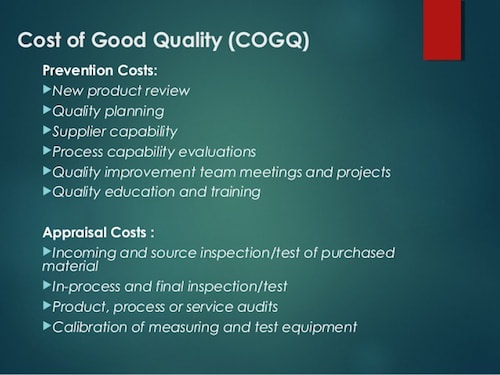
#3: Appraisal Costs:
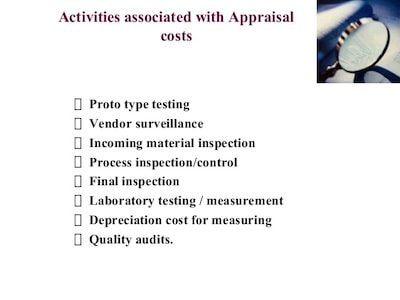
What is appraisal cost?
These are the costs that are incurred by a company to inspect and measure the quality of a product or service. Some examples include:
Learn more about appraisal cost 6 sigma.
These are the costs that are incurred by a company to inspect and measure the quality of a product or service. Some examples include:
- Testing: All testing procedures aim to ensure quality levels.
- Inspection: This cost can occur in multiple stages from the development stage to the delivery and even the manufacturing stage.
- Quality Audits: Periodically, companies should conduct random quality audits that also have costs.
Learn more about appraisal cost 6 sigma.
#4: Prevention Costs:
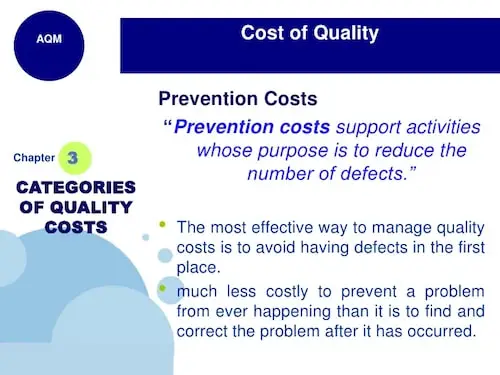
As you can see by its name, prevention costs include all the costs that a company can have when it is trying to prevent all forms of defects in a service or product. These can include:
- Policies And Procedures: These costs may include the quality of materials, labor requirements as well as development and even review of the standards and rules that affect the incidence of defects.
- Design Reviews: These are the costs that refer to the assessment and evaluation of a product or service to detect problems and defects before the production.
- Training And Education: Training and education are required for employees to increase their skills as well as to decrease the likelihood of defects.

 RSS Feed