
Value Stream Mapping Explained
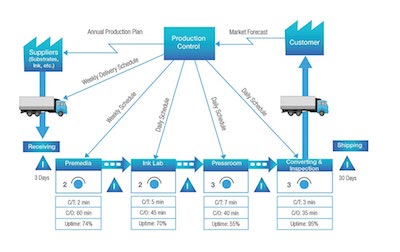
The value stream mapping is one of the many lean manufacturing techniques that is used to document, analyze, and improve the flow of both information and inventory. To avoid any possible confusion, there are differences between the value stream mapping and the Six Sigma process mapping. The value stream mapping:
- Gathers a lot more information than a typical process map;
- Is usually used at a broader level, from receiving the supplies to delivery of the final products;
- Is usually used as a way to identify where the future projects should focus, as well as the subprojects, and the kaizen events.
A value stream map needs to take into account much different information, from the management to the activity of the product, not forgetting all the information systems that support the process. This is particularly helpful when you want to decrease the time spent on one process since you'll be connecting the dots between the decision-making and the process flow.
There are many different reasons why you should use a lean process mapping. Here are the main 3:
- Many companies who are using the lean manufacturing approach reached the conclusion that simple improving events aren't enough;
- While one improvement event will create a localized improvement, with the value stream map and consequent analysis, you'll gain a complete vision about how the different activities inside your company work together;
- the lean process mapping is one of the most powerful tools that allows you to locate waste as well as it is the perfect tool to help you plan on how to get rid of it.
When we're talking about value, we're talking about whether or not you have the ability to provide your customers with the best quality at an appropriate price, at the right time. Basically, we're talking about your customer's satisfaction.
So, when you discover the waste you have and plan out different ways to eliminate it, you're ultimately contributing to your customer's satisfaction. Your products' quality can be improved, the price can decrease and the waiting time can be reduced. If you eliminate the waste, your company will be more competitive and, at the same time, will provide a better service for your customers.
When you're making your value stream map, the first thing you need to do is to specify what value means from your customer's point of view. Only after realizing this value is that you can proceed with the identification of the value stream for each product you have. Then, you'll create your map according to the product flow and will look into it to see what you can do to optimize it by reducing (or eliminating) the waste. This is a never-ending task because there are always things that you can do to improve. So, the search for perfection is a constant when you want to have a successful business.
Now that you know what a value stream mapping is and how you can use it for your business, you might want to know more about other methodologies that you can use that can help you grow your business. You can read more about lean six sigma topics here.
Now that you know what a value stream mapping is and how you can use it for your business, you might want to know more about other methodologies that you can use that can help you grow your business. You can read more about lean six sigma topics here.