
Central Limit Theorem
The Central Limit Theorem is one of the cornerstones of lean six sigma and one of the first concepts understood in lean six sigma statistical training. We know that as we collect data from a process, the data points may or may not represent a normal distribution. However, when large enough (n>30) samples are drawn from any distribution, the distribution of the sample means approaches a normal one.
These conditions define the Central Limit Theorem. The more the distribution resembles normal, the fewer samples are needed to create normal sample mean distribution and confirm the theorem. A reverse logic is also true. The more the distribution deviates from normal, greater number of samples are needed to demonstrate the Central Limit Theorem.
To understand how Central Limit Theorem it is important to be familiar with the normal distribution. It is represented graphically by a normal or “bell” curve; called such because of its striking similarity to the shape of a bell:
|
|
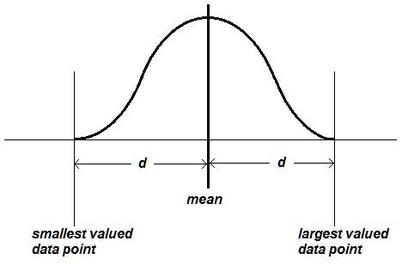
The figure above shows normal distribution and is the root of lean six sigma projects. The average value of all data points in the distribution is statistically known as the mean. The mean also represents the largest number of individual data points in a population of data, with declining quantities of data point values both smaller and larger than the mean. The lowest and highest value of individual data points represents the smallest quantity of data points, always at the extreme edges of the curve in a normal distribution. The normal distribution also means that the distribution spread is virtually the same on either side of the mean (shown as d), meaning that the mean is centered in the distribution.
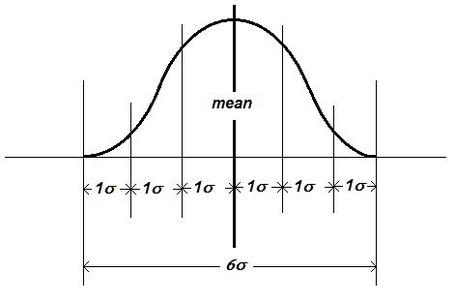
Normal distribution is critical to lean six sigma as it addresses any process analysis by segmenting the total data distribution into six equal distribution zones, each equal to one sigma (1s), also known as “standard deviation,” and two groups of three sigma (3s) each bisected by the mean, with the total sum equal to, and thus the designation, lean six sigma.
Normal distribution is critical to lean six sigma as it addresses any process analysis by segmenting the total data distribution into six equal distribution zones, each equal to one sigma (1s), also known as “standard deviation,” and two groups of three sigma (3s) each bisected by the mean, with the total sum equal to, and thus the designation, lean six sigma.
It is often impractical to collect all existing information (referred as population in statistics) on processes targeted by lean six sigma projects. That’s where the Central Limit Theorem finds its application. Gathering subsets of data (referred as sample in statistics) commonly provides practical and cheaper way to draw conclusions about the population. For example, a lean six sigma team led by a LSS black belt can collect random and sufficiently large samples from a manufacturing process. This way the team can study the distribution of sample means and draw conclusion about stability of the manufacturing process.
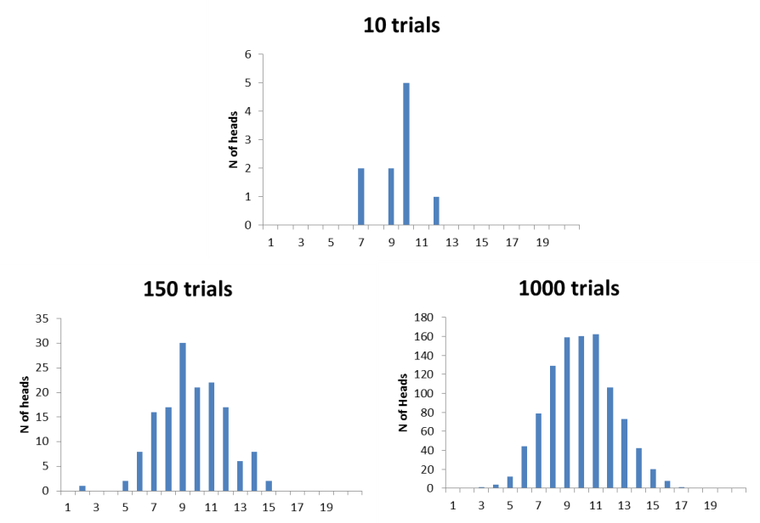
The Central Limit Theorem can be demonstrated by a coin-toss exercise (don’t worry you don’t need a lean six sigma black belt certification to do it). Take a coin and toss it 20 times. As you let it fall to a table, you will be getting either heads or tails. Count how many heads you get. Repeat this exercise 10 times. Probability dictates that you should be getting 10 heads when you toss a coin 20 times because of 50% probability to flip heads. However, this won’t be the case for every coin tossing exercise (called trials in statistics) that you go through. You will probably end up also seeing 12 head and 8 tails, 14 heads 6 tails, 7 heads and 13 tails and any other imaginable combination. Now if you plot the results on a frequency distribution table (histogram) you will see that the most frequently you have been getting 10 heads or close to ten. You should see extreme numbers such as 16 or 3 heads much less often. Therefore, a distribution of heads frequency per trial should be peaked in the center indicating frequent occurrence of 10 heads. It will resemble normal. If this exercise is repeated 150 times (instead of 10) frequency distribution of heads showing up will be becoming more normal and peaked. As you can see on the frequency distribution tables (histograms) below, the more coin tossing exercises (trials) we have the more normal the distribution becomes.
The Central Limit Theorem can be demonstrated by a coin-toss exercise (don’t worry you don’t need a lean six sigma black belt certification to do it). Take a coin and toss it 20 times. As you let it fall to a table, you will be getting either heads or tails. Count how many heads you get. Repeat this exercise 10 times. Probability dictates that you should be getting 10 heads when you toss a coin 20 times because of 50% probability to flip heads. However, this won’t be the case for every coin tossing exercise (called trials in statistics) that you go through. You will probably end up also seeing 12 head and 8 tails, 14 heads 6 tails, 7 heads and 13 tails and any other imaginable combination. Now if you plot the results on a frequency distribution table (histogram) you will see that the most frequently you have been getting 10 heads or close to ten. You should see extreme numbers such as 16 or 3 heads much less often. Therefore, a distribution of heads frequency per trial should be peaked in the center indicating frequent occurrence of 10 heads. It will resemble normal. If this exercise is repeated 150 times (instead of 10) frequency distribution of heads showing up will be becoming more normal and peaked. As you can see on the frequency distribution tables (histograms) below, the more coin tossing exercises (trials) we have the more normal the distribution becomes.
The classic Central Limit Theorem formula to calculate the mean, or sample average of a distribution is:
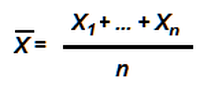
where X-Bar is the mean, X1 + … + Xn is the sum of all sample measurements in the population, and n is the total number of measured samples. The theorem depends on the probability that as the population of measured samples increases toward infinity, the more normal the distribution will be. However, it is also important to realize that either long-term single production runs, separately measured by shift of days, or separate production runs may incur variation in process factors (material, equipment, method, environment, manpower), which may result in variable means and distributions. Understanding how, why and when these variables occur, and what effect they have on distribution, is critical to maintaining process control.
As difficult as this fact of variation may be, there is no doubt that the use of the Central Limit Theorem is critical in the prediction of what a process will produce; a key component of lean six sigma black belt and green belt training.
As difficult as this fact of variation may be, there is no doubt that the use of the Central Limit Theorem is critical in the prediction of what a process will produce; a key component of lean six sigma black belt and green belt training.
Watch about Central Limit Theorem |