
Simply put, a histogram is a type of graph that has a wide range of uses in statistics.
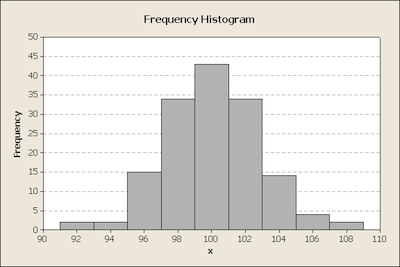
One of the best things about histograms is that they deliver a visual interpretation of numerical data. And they do it by showing the number of data points that lie within a range of values.
The frequency of the data which falls within each class is then shown by the use of a bar. So, the higher the bar in the histogram, the greater the frequency of data values.
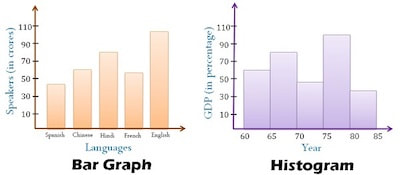
Histogram Vs Bar Graph
Many people tend to confuse a histogram with a graph bar. However, and even though they are similar in shape since they both use vertical bars to display data, they are different.
Discover how to make a histogram.
Overall speaking, the height of a bar corresponds to the relative frequency of the amount of data in the class. So, the higher the bar, the higher the frequency of the data. On the other hand, the lower the bar, the lower the frequency of data. However, appearances may be deceiving. It is here that the similarities end between the two kinds of graphs.
The truth is that both graphs are different and the main difference is related to the level of measurement of the data.
If you think about it, bar graphs tend to be used for data at the nominal level of measurement. So, as you can easily understand, bar charts measure the frequency of categorical data, and the classes for a bar graph are these categories.
Not sure how to construct a histogram?
In what concerns the histogram, histograms are used for data that is at least at the ordinal level of measurement. The classes for a histogram are ranges of values.
However, this isn't the only difference between a histogram and a bar graph. After all, there is also a different way to order the bars.
When you are using a bar graph, it is normal that rearrange the bars in order of decreasing height. However, when you are using a histogram, you simply can't reorder the bars. They need to be displayed in the order that the classes occur.
Histograms And Probabilities
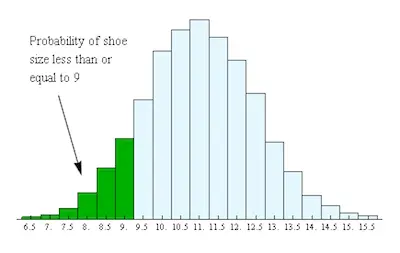
One of the uses of a histogram is related to probabilities. The truth is that discrete probability distributions can be represented with a histogram.
In case you are looking to construct a histogram that represents a probability distribution, then you will need to start by choosing the classes first. Notice that these should be the outcomes of a probability experiment. In terms of the width of each one of these classes, it should be only one unit. Looking at the heights of the bars of the histogram, you will be able to see the probabilities for each one of the different outcomes. So, when you construct such a histogram, you can also say that the areas of the bars are also probabilities.
Learn more about constructing a histogram.
Other Applications For Histograms
The truth is that histograms can be quite handy in a wide range of areas and not only for probabilities. In fact, when you are trying to compare the frequency of occurrence of quantitative data, you can use a histogram to depict your data set.
 RSS Feed