
Z Score Table
Use these z score tables to find areas under normal curve
|
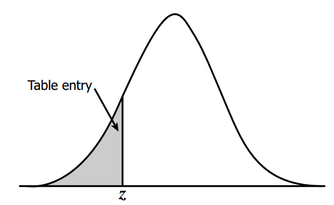
Find values on the left of the mean in this Z table. Table entries for z represent the area under the bell curve to the left of z. Negative scores in the Z table correspond to the values which are less than the mean.
|
| Negative z-scores: | ||||||||||
|---|---|---|---|---|---|---|---|---|---|---|
| z | 0.09 | 0.08 | 0.07 | 0.06 | 0.05 | 0.04 | 0.03 | 0.02 | 0.01 | 0 |
| -3.4 | 0.0002 | 0.0003 | 0.0003 | 0.0003 | 0.0003 | 0.0003 | 0.0003 | 0.0003 | 0.0003 | 0.0003 |
| -3.3 | 0.0003 | 0.0004 | 0.0004 | 0.0004 | 0.0004 | 0.0004 | 0.0004 | 0.0005 | 0.0005 | 0.0005 |
| -3.2 | 0.0005 | 0.0005 | 0.0005 | 0.0006 | 0.0006 | 0.0006 | 0.0006 | 0.0006 | 0.0007 | 0.0007 |
| -3.1 | 0.0007 | 0.0007 | 0.0008 | 0.0008 | 0.0008 | 0.0008 | 0.0009 | 0.0009 | 0.0009 | 0.001 |
| -3 | 0.001 | 0.001 | 0.0011 | 0.0011 | 0.0011 | 0.0012 | 0.0012 | 0.0013 | 0.0013 | 0.0013 |
| -2.9 | 0.0014 | 0.0014 | 0.0015 | 0.0015 | 0.0016 | 0.0016 | 0.0017 | 0.0018 | 0.0018 | 0.0019 |
| -2.8 | 0.0019 | 0.002 | 0.0021 | 0.0021 | 0.0022 | 0.0023 | 0.0023 | 0.0024 | 0.0025 | 0.0026 |
| -2.7 | 0.0026 | 0.0027 | 0.0028 | 0.0029 | 0.003 | 0.0031 | 0.0032 | 0.0033 | 0.0034 | 0.0035 |
| -2.6 | 0.0036 | 0.0037 | 0.0038 | 0.0039 | 0.004 | 0.0041 | 0.0043 | 0.0044 | 0.0045 | 0.0047 |
| -2.5 | 0.0048 | 0.0049 | 0.0051 | 0.0052 | 0.0054 | 0.0055 | 0.0057 | 0.0059 | 0.006 | 0.0062 |
| -2.4 | 0.0064 | 0.0066 | 0.0068 | 0.0069 | 0.0071 | 0.0073 | 0.0075 | 0.0078 | 0.008 | 0.0082 |
| -2.3 | 0.0084 | 0.0087 | 0.0089 | 0.0091 | 0.0094 | 0.0096 | 0.0099 | 0.0102 | 0.0104 | 0.0107 |
| -2.2 | 0.011 | 0.0113 | 0.0116 | 0.0119 | 0.0122 | 0.0125 | 0.0129 | 0.0132 | 0.0136 | 0.0139 |
| -2.1 | 0.0143 | 0.0146 | 0.015 | 0.0154 | 0.0158 | 0.0162 | 0.0166 | 0.017 | 0.0174 | 0.0179 |
| -2 | 0.0183 | 0.0188 | 0.0192 | 0.0197 | 0.0202 | 0.0207 | 0.0212 | 0.0217 | 0.0222 | 0.0228 |
| -1.9 | 0.0233 | 0.0239 | 0.0244 | 0.025 | 0.0256 | 0.0262 | 0.0268 | 0.0274 | 0.0281 | 0.0287 |
| -1.8 | 0.0294 | 0.0301 | 0.0307 | 0.0314 | 0.0322 | 0.0329 | 0.0336 | 0.0344 | 0.0351 | 0.0359 |
| -1.7 | 0.0367 | 0.0375 | 0.0384 | 0.0392 | 0.0401 | 0.0409 | 0.0418 | 0.0427 | 0.0436 | 0.0446 |
| -1.6 | 0.0455 | 0.0465 | 0.0475 | 0.0485 | 0.0495 | 0.0505 | 0.0516 | 0.0526 | 0.0537 | 0.0548 |
| -1.5 | 0.0559 | 0.0571 | 0.0582 | 0.0594 | 0.0606 | 0.0618 | 0.063 | 0.0643 | 0.0655 | 0.0668 |
| -1.4 | 0.0681 | 0.0694 | 0.0708 | 0.0721 | 0.0735 | 0.0749 | 0.0764 | 0.0778 | 0.0793 | 0.0808 |
| -1.3 | 0.0823 | 0.0838 | 0.0853 | 0.0869 | 0.0885 | 0.0901 | 0.0918 | 0.0934 | 0.0951 | 0.0968 |
| -1.2 | 0.0985 | 0.1003 | 0.102 | 0.1038 | 0.1056 | 0.1075 | 0.1093 | 0.1112 | 0.1131 | 0.1151 |
| -1.1 | 0.117 | 0.119 | 0.121 | 0.123 | 0.1251 | 0.1271 | 0.1292 | 0.1314 | 0.1335 | 0.1357 |
| -1 | 0.1379 | 0.1401 | 0.1423 | 0.1446 | 0.1469 | 0.1492 | 0.1515 | 0.1539 | 0.1562 | 0.1587 |
| -0.9 | 0.1611 | 0.1635 | 0.166 | 0.1685 | 0.1711 | 0.1736 | 0.1762 | 0.1788 | 0.1814 | 0.1841 |
| -0.8 | 0.1867 | 0.1894 | 0.1922 | 0.1949 | 0.1977 | 0.2005 | 0.2033 | 0.2061 | 0.209 | 0.2119 |
| -0.7 | 0.2148 | 0.2177 | 0.2206 | 0.2236 | 0.2266 | 0.2296 | 0.2327 | 0.2358 | 0.2389 | 0.242 |
| -0.6 | 0.2451 | 0.2483 | 0.2514 | 0.2546 | 0.2578 | 0.2611 | 0.2643 | 0.2676 | 0.2709 | 0.2743 |
| -0.5 | 0.2776 | 0.281 | 0.2843 | 0.2877 | 0.2912 | 0.2946 | 0.2981 | 0.3015 | 0.305 | 0.3085 |
| -0.4 | 0.3121 | 0.3156 | 0.3192 | 0.3228 | 0.3264 | 0.33 | 0.3336 | 0.3372 | 0.3409 | 0.3446 |
| -0.3 | 0.3483 | 0.352 | 0.3557 | 0.3594 | 0.3632 | 0.3669 | 0.3707 | 0.3745 | 0.3783 | 0.3821 |
| -0.2 | 0.3829 | 0.3897 | 0.3936 | 0.3974 | 0.4013 | 0.4052 | 0.409 | 0.4129 | 0.4168 | 0.4207 |
| -0.1 | 0.4247 | 0.4286 | 0.4325 | 0.4364 | 0.4404 | 0.4443 | 0.4483 | 0.4522 | 0.4562 | 0.4602 |
| 0 | 0.4641 | 0.4681 | 0.4721 | 0.4761 | 0.4801 | 0.484 | 0.488 | 0.492 | 0.496 | 0.5 |
|
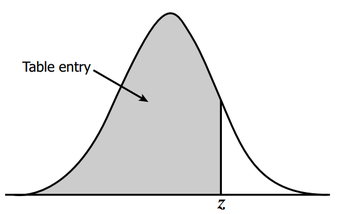
Find values on the right of the mean. Table entries for z represent the area under the bell curve to the left of z. Positive scores in the Z table correspond to the values which are greater than the mean.
|
| Positive z-scores: | ||||||||||
|---|---|---|---|---|---|---|---|---|---|---|
| z | 0 | 0.01 | 0.02 | 0.03 | 0.04 | 0.05 | 0.06 | 0.07 | 0.08 | 0.09 |
| 0 | 0.5 | 0.504 | 0.508 | 0.512 | 0.516 | 0.5199 | 0.5239 | 0.5279 | 0.5319 | 0.5359 |
| 0.1 | 0.5398 | 0.5438 | 0.5478 | 0.5517 | 0.5557 | 0.5596 | 0.5636 | 0.5675 | 0.5714 | 0.5753 |
| 0.2 | 0.5793 | 0.5832 | 0.5871 | 0.591 | 0.5948 | 0.5987 | 0.6026 | 0.6064 | 0.6103 | 0.6141 |
| 0.3 | 0.6179 | 0.6217 | 0.6255 | 0.6293 | 0.6331 | 0.6368 | 0.6406 | 0..6443 | 0.648 | 0.6517 |
| 0.4 | 0.6554 | 0.6591 | 0.6628 | 0.6664 | 0.67 | 0.6736 | 0.6772 | 0.6808 | 0.6844 | 0.6879 |
| 0.5 | 0.6915 | 0.695 | 0.6985 | 0.7019 | 0.7054 | 0.7088 | 0.7123 | 0.7157 | 0.719 | 0.7224 |
| 0.6 | 0.7257 | 0.7291 | 0.7324 | 0.7357 | 0.7389 | 0.7422 | 0.7454 | 0.7486 | 0.7517 | 0.7549 |
| 0.7 | 0.758 | 0.7611 | 0.7642 | 0.7673 | 0.7704 | 0.7734 | 0.7764 | 0.7794 | 0.7823 | 0.7852 |
| 0.8 | 0.7881 | 0.791 | 0.7939 | 0.7967 | 0.7995 | 0.8023 | 0.8051 | 0.8078 | 0.8106 | 0.8133 |
| 0.9 | 0.8159 | 0.8186 | 0.8212 | 0.8238 | 0.8264 | 0.8289 | 0.8315 | 0.834 | 0.8365 | 0.8389 |
| 1 | 0.8413 | 0.8438 | 0.8461 | 0.8485 | 0.8508 | 0.8531 | 0.8554 | 0.8577 | 0.8599 | 0.8621 |
| 1.1 | 0.8643 | 0.8665 | 0.8686 | 0.8708 | 0.8729 | 0.8749 | 0.877 | 0.879 | 0.881 | 0.883 |
| 1.2 | 0.8849 | 0.8869 | 0.8888 | 0.8907 | 0.8925 | 0.8944 | 0.8962 | 0.898 | 0.8997 | 0.9015 |
| 1.3 | 0.9032 | 0.9049 | 0.9066 | 0.9082 | 0.9099 | 0.9115 | 0.9131 | 0.9147 | 0.9162 | 0.9177 |
| 1.4 | 0.9192 | 0.9207 | 0.9222 | 0.9236 | 0.9251 | 0.9265 | 0.9279 | 0.9292 | 0.9306 | 0.9319 |
| 1.5 | 0.9332 | 0.9345 | 0.9357 | 0.937 | 0.9382 | 0.9394 | 0.9406 | 0.9418 | 0.9429 | 0.9441 |
| 1.6 | 0.9452 | 0.9463 | 0.9474 | 0.9484 | 0.9495 | 0.9505 | 0.9515 | 0.9525 | 0.9535 | 0.9545 |
| 1.7 | 0.9554 | 0.9564 | 0.9573 | 0.9582 | 0.9591 | 0.9599 | 0.9608 | 0.9616 | 0.9625 | 0.9633 |
| 1.8 | 0.9641 | 0.9649 | 0.9656 | 0.9664 | 0.9671 | 0.9678 | 0.9686 | 0.9693 | 0.9699 | 0.9706 |
| 1.9 | 0.9713 | 0.9719 | 0.9726 | 0.9732 | 0.9738 | 0.9744 | 0.975 | 0.9756 | 0.9761 | 0.9767 |
| 2 | 0.9772 | 0.9778 | 0.9783 | 0.9788 | 0.9793 | 0.9798 | 0.9803 | 0.9808 | 0.9812 | 0.9817 |
| 2.1 | 0.9821 | 0.9826 | 0.983 | 0.9834 | 0.9838 | 0.9842 | 0.9846 | 0.985 | 0.9854 | 0.9857 |
| 2.2 | 0.9861 | 0.9864 | 0.9868 | 0.9871 | 0.9875 | 0.9878 | 0.9881 | 0.9884 | 0.9887 | 0.989 |
| 2.3 | 0.9893 | 0.9896 | 0.9898 | 0.9901 | 0.9904 | 0.9906 | 0.9909 | 0.9911 | 0.9913 | 0.9916 |
| 2.4 | 0.9918 | 0.992 | 0.9922 | 0.9925 | 0.9927 | 0.9929 | 0.9931 | 0.9932 | 0.9934 | 0.9936 |
| 2.5 | 0.9938 | 0.994 | 0.9941 | 0.9943 | 0.9945 | 0.9946 | 0.9948 | 0.9949 | 0.9951 | 0.9952 |
| 2.6 | 0.9953 | 0.9955 | 0.9956 | 0.9957 | 0.9959 | 0.996 | 0.9961 | 0.9962 | 0.9963 | 0.9964 |
| 2.7 | 0.9965 | 0.9966 | 0.9967 | 0.9968 | 0.9969 | 0.997 | 0.9971 | 0.9972 | 0.9973 | 0.9974 |
| 2.8 | 0.9974 | 0.9975 | 0.9976 | 0.9977 | 0.9977 | 0.9978 | 0.9979 | 0.9979 | 0.998 | 0.9981 |
| 2.9 | 0.9981 | 0.9982 | 0.9982 | 0.9983 | 0.9984 | 0.9984 | 0.9985 | 0.9985 | 0.9986 | 0.9986 |
| 3 | 0.9987 | 0.9987 | 0.9987 | 0.9988 | 0.9988 | 0.9989 | 0.9989 | 0.9989 | 0.999 | 0.999 |
| 3.1 | 0.999 | 0.9991 | 0.9991 | 0.9991 | 0.9992 | 0.9992 | 0.9992 | 0.9992 | 0.9993 | 0.9993 |
| 3.2 | 0.9993 | 0.9993 | 0.9994 | 0.9994 | 0.9994 | 0.9994 | 0.9994 | 0.9995 | 0.9995 | 0.9995 |
| 3.3 | 0.9995 | 0.9995 | 0.9995 | 0.9996 | 0.9996 | 0.9996 | 0.9996 | 0.9996 | 0.9996 | 0.9997 |
| 3.4 | 0.9997 | 0.9997 | 0.9997 | 0.9997 | 0.9997 | 0.9997 | 0.9997 | 0.9997 | 0.9997 | 0.9998 |