
Visual Factory

A Visual Factory is the term used to refer to the fact when the information is displayed using signs and charts. This is used mostly on a Lean Production environment.
The main goal of the Visual Factory is to allow you to easily visualize all the activities inside the organization. These informations usually include:
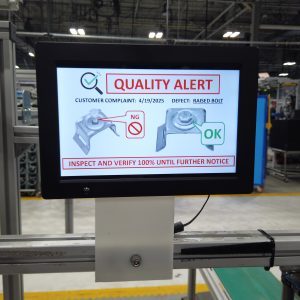
- safety information - include the visual identification of hazards and safe areas
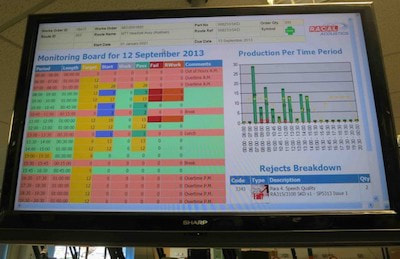
- process measures - include run charts, achievement to target KPIs and progress, reject rates, among others
- work instructions - instead of having a written document with the work instructions, these are displayed with the help of samples, flow charts, photographs, among others.
The main goal of the Visual Factory is to allow you to easily visualize all the activities inside the organization. These informations usually include:
- safety information - include the visual identification of hazards and safe areas
- process measures - include run charts, achievement to target KPIs and progress, reject rates, among others
- work instructions - instead of having a written document with the work instructions, these are displayed with the help of samples, flow charts, photographs, among others.
The term visual factory is more and more popular within companies and organizations. The truth is that visual factory refers to an approach to lean manufacturing processes that are based on visual information throughout the workplace.
Ultimately, you can see the visual factory as a powerful and intuitive system of communication at the time and place it is needed.
Ultimately, you can see the visual factory as a powerful and intuitive system of communication at the time and place it is needed.
One of the things that is important to retain is the fact that visual controls improve working areas simply by:
As you can understand, by using these visual tools to give employees all the information they need, where they need, and when they need it, their productivity will improve.
- answering questions
- describing procedures and actions
- identifying materials, equipment, and locations
- providing precautionary information and safety warnings.
As you can understand, by using these visual tools to give employees all the information they need, where they need, and when they need it, their productivity will improve.
How Does A Visual Factory Lean Manufacturing Work?
A visual factory lean manufacturing uses a wide range of charts, signs, labels, infographics, and other communication tools to provide data in an efficient way.
The reality is when you display the information throughout the company using visuals instead of texts, there is a huge time-saving.
In case you are looking to implement the visual factory lean manufacturing, then you need to consider displaying this kind of visuals in the work processes and you should ensure that you include all the information an employe needs to complete their tasks.
Now that you already know where you need to place these visuals, you will need to consider the best ones to share the information with the employees.
Notice that the main goal of these visuals is to ensure that they are accurate and that they are easy to read and understand at a glance. These visual tools should include:
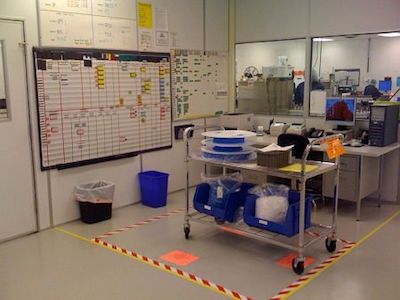
- Electrical display boards, which provide real-time information about the status of production (or a process) within a facility and alerts workers whenever assistance is needed
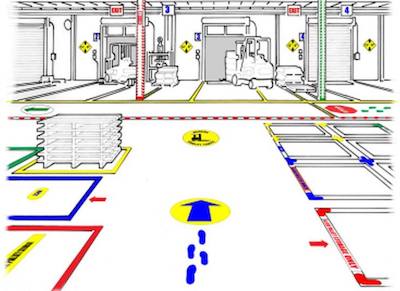
- Floor marking aids and wayfinding signs, which can help employees find walkways, entrances, exits, navigational aids, and other instructions.
- Signs and labels that designate inventory, storage, tools, and other vital resources.
The Main Benefits Of A Visual Factory
As you are fully aware by now, a visual factory has a wide range of benefits. However, we can definitely state that the most important ones are:
- Improved productivity and output
- Clear, simplified instructions in complex environments
- Safer workplace (given the clear, intentional visual communication)
- Higher profits (due to more efficient processes)
- Fewer errors and less guesswork throughout a work process.
Different Visual Factory Solutions
One of the best things about using visual factory is the fact that you can use a wide range of signage and labeling within your company or organization. However, you want to ensure that the labels and signs that you display are not only thoughtful as well as they should give employees the information they need and contribute toward the success of their company through clear communication.
A major part of visual factory that many companies tend to forget about is the floor and aisle marking. However, this part is very important since it allows employees to always find their way and never forget about the details that may end up having an incredible importance in the end.
A major part of visual factory that many companies tend to forget about is the floor and aisle marking. However, this part is very important since it allows employees to always find their way and never forget about the details that may end up having an incredible importance in the end.