
Pareto Analysis and Pareto Chart
A Pareto Analysis and associated Pareto Chart are essential tools used in lean six sigma to identify comparative frequency of occurrence of a group of measured effects in a process. This technique is used to analyze which effects on a process should be prioritized for improvement. For example, one may want to determine the frequency of observed process failures or the most significant contributing costs of those failures.
Pareto Analysis helps determine whether the frequency of occurrence of failures, the cost of failure, or the effect failures have on downstream processes are of greatest priority to address for improvement. For example, the results of Pareto analysis may show that the most frequently occurring failure is a size variation of a particular part feature, but its relative cost may be insignificant, or its effect on downstream processes may be minimal. Therefore, the analysis should determine that another failure, although occurring less frequently, may have greater potential for cost-saving improvement.
Pareto Analysis is one of the easiest and most effective tools for prioritizing problems. As a result, a Pareto Chart is often used in lean six sigma projects. Pareto Analysis and the Chart should be learned and understood in lean six sigma exam preparation, whether the objective is successful completion of a black belt certification exam or a green belt certification exam.
Pareto Chart
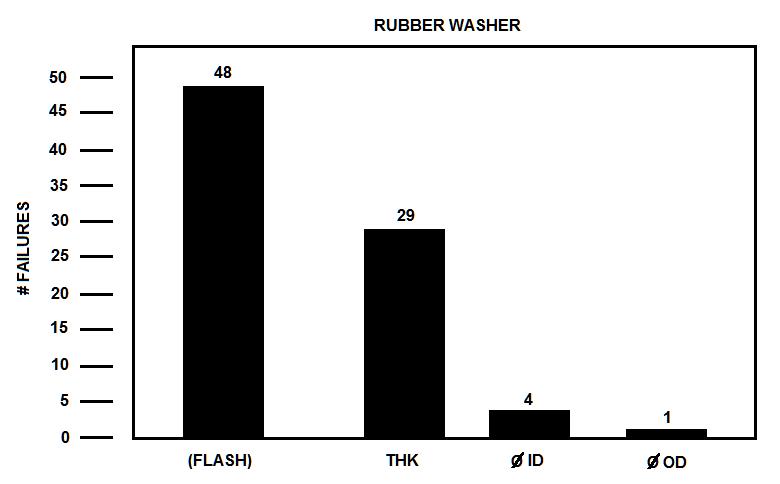
Let’s suppose we want to know the number of each of three dimensional failures that occur in a process that molds a rubber washer of one inch diameter (outside), ½ inch (inside), and ¼ inch thickness. We take all measurements after molding and vulcanization every ten minutes for eight hours; six per hour. Therefore, we have 48 data points for each feature over eight hours.
A Pareto Chart displays failure modes frequency, usually represented by a bar chart, and arranges the failures in greatest to least occurrence. From the data collected above, and displayed in the chart below, we see that the diameters are usually holding within tolerance for each diameter, but thickness exceeds tolerance consistently, with noted excessive flash at the parting line (not included in the original three search parameters). We would create a simple bar chart of these failures as follows:
|
|
The Pareto Chart indicates that all 48 samples exhibited parting line flash, 29 were oversize in thickness, 4 had oversize o.d. and 1 was undersize i.d. The four failure modes are arranged in order of frequency, greatest to least, for easy prioritization. Analysis may reveal that the last two diameter features were insignificant for immediate improvement consideration. However, the first two, flash, which was not an originally identified failure, and thickness, caused many failures and may be related by cause.
The results of the Pareto Chart and subsequent Analysis in our example determined that the two failures were related. Investigation of other measured and documented data indicated that both failures were caused by lack of sufficient pressure to keep the mold fully closed during injection of molten material. The Pareto Chart was key in prioritizing the several failure modes observed, and consequential Pareto Analysis correctly and quickly identified the cause.
The results of the Pareto Chart and subsequent Analysis in our example determined that the two failures were related. Investigation of other measured and documented data indicated that both failures were caused by lack of sufficient pressure to keep the mold fully closed during injection of molten material. The Pareto Chart was key in prioritizing the several failure modes observed, and consequential Pareto Analysis correctly and quickly identified the cause.

Pareto Analysis and the 80/20 Rule
Pareto Analysis addresses collected data by prioritizing that data according to predetermined factors in a lean six sigma project. If we want to know which failures in a process occur most frequently over a defined period of time, we simply count them as they occur. If we want to know which failures cause the greatest cost to the process, we simply multiply the results of the frequency occurrence with the known cost of each failure. As noted above, some failures are very costly even if they occur infrequently. Therefore, the analysis must be conducted dispassionately. It should be objective and exacting because it makes no sense to attack a problem whose cost of correction in dollars is extreme and saves only a few pennies.
In order to focus on the most important problem factors, the analysis typically employs a simple rule called “Pareto Principle,” also known as the “80/20 Rule.” This rule dictates that 20 percent of causes results in 80 percent of the problems or failures. The implication is that focusing on the improvement of 20 percent (instead of trying to attack all the problem causing factors) will have the best return on the effort and will be the most cost effective.
Both the Pareto Chart and Pareto Analysis are critical tools in lean six sigma projects. In lean six sigma exam preparation, learning about these simple, effective tools will help successfully pass a Lean Six Sigma (LSS) black belt or green belt certification exam.