
Systematic Sampling
There are many different sampling methods. One of the most commonly used is the Systematic Sampling. The systematic sampling implies that you will take a sample of the available data in a set pattern, instead of taking a sample at random.
The systematic sampling is usually used because it's very economic and convenient. However, you need to be careful because there's a risk of an unsuspected systematic pattern appear in the data.
A simple example of a systematic sampling is calling every ninetieth caller listed in the phone book.
The systematic sampling is usually used because it's very economic and convenient. However, you need to be careful because there's a risk of an unsuspected systematic pattern appear in the data.
A simple example of a systematic sampling is calling every ninetieth caller listed in the phone book.
The reality is that systematic sampling tends to be used in many different areas or industries. While systematic sampling is related to statistics, it can be used by many different industries.
What Is Systematic Sampling?
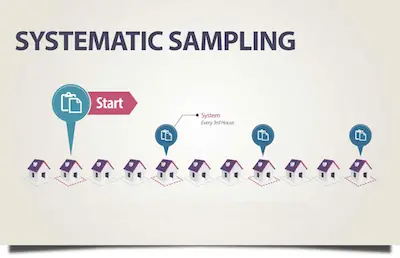
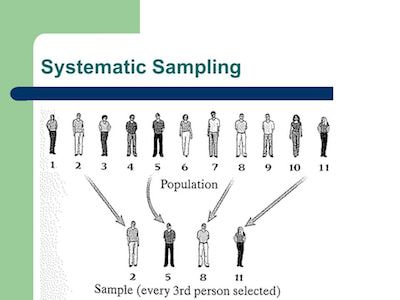
Simply put, systematic sampling is just a type of probability sampling method where sample members from a larger population are picked according to a random starting point but with a fixed, periodic interval. When you are looking to calculate this interval, which is called sampling interval, you just need to divide the population size by the desired sample size.
One of the most interesting things about the systematic sampling definition is the fact that while you may select the sample population in advance, systematic sampling is still thought to be random if the periodic interval is determined beforehand and the starting point is random.
One of the most interesting things about the systematic sampling definition is the fact that while you may select the sample population in advance, systematic sampling is still thought to be random if the periodic interval is determined beforehand and the starting point is random.
How The Systematic Sampling Works
Now that you already know the systematic sampling definition, it is time to learn how it works.
One of the things that you need to know is that the simple random sampling of a population may be not only time-consuming but also inefficient. So, many statisticians tend to look for different methods like systematic sampling.
The reality is that the process of systematic sampling is very simple. Not only you can choose a sample size through a systematic approach very quickly as there are also advantages as well. Notice that as soon as you identify a fixed starting point, you will select a constant interval to facilitate participant selection.
One of the main benefits of using systematic sampling instead of simple random sampling is the fact that there is a lower risk of data manipulation.
The reality is that systematic sampling is a very popular method among analysts and researchers. And the main reason relies on its simplicity. Overall, researchers tend to assume the results are representative of most normal populations unless a random characteristic disproportionately exists with every "nth" data sample (which is unlikely). So, this means that a population needs to exhibit a natural degree of randomness along with the chosen metric. If the population has a type of standardized pattern, the risk of accidentally choosing very common cases is more apparent.
Within systematic sampling, as with other sampling methods, a target population must be selected prior to selecting participants. In addition, a population can be identified based on any number of desired characteristics that suit the purpose of the study being conducted. Some selection criteria may include location, age, race, gender, education level and/or profession.
Limitations Of Systematic Sampling
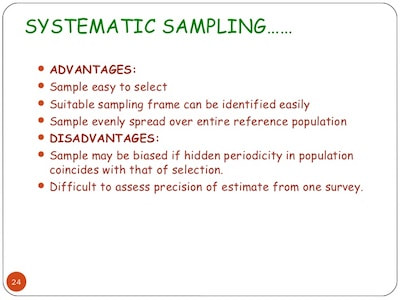
While systematic sampling seems to be a very efficient methodology, the reality is that it also has its own limitations.
One of the risks that researchers and statisticians need to consider when they are conducting systematic sampling is related to how the list used with the sampling interval is organized. When the population placed on the list is organized in a cyclical pattern that matches the sampling interval, the selected sample may be biased.
Let's take an example so that you can fully understand this limitation. Imagine that a specific company's human resources department wants to pick a sample of employees and ask how they feel about company policies. Employees are grouped in teams of 20, with each team headed by a manager. If the list used to pick the sample size is organized with teams clustered together, the statistician risks picking only managers (or no managers at all) depending on the sampling interval.