
Lean Six Sigma Training Guide
  • IASSC Free Training Guide
  • Free Lean Six Sigma Training Guide
  • ASQ Free Training Guide
  • Body of Knowledge
  • Practice Exams
    • Six Sigma Quick Training Tests >
      • Lean Six Sigma Practice Test 1
      • Lean Six Sigma Practice Test 2
      • Lean Six Sigma Practice Test 3
      • Lean Six Sigma Practice Test 4
      • Lean Six Sigma Practice Test 5
      • Lean Six Sigma Practice Test 6
      • Lean Six Sigma Practice Test 7
      • Lean Six Sigma Practice Test 8
      • Lean Six Sigma Practice Test 9
      • Lean Six Sigma Practice Test 10
      • Lean Six Sigma Practice Test 11
      • Lean Six Sigma Practice Test 12
    • Six Sigma DMAIC Training Tests >
      • DEFINE Six Sigma Training Test
      • MEASURE Six Sigma Training Test
      • ANALYZE Six Sigma Training Test
      • IMPROVE Six Sigma Training Test
      • CONTROL Six Sigma Training Test
    • IASSC, ASQ and Other Exams >
      • IASSC Six Sigma Black Belt Exam
      • IASSC Six Sigma Green Belt Exam
      • IASSC Six Sigma Yellow Belt Exam
      • Lean Six Sigma Exams By Topic >
        • I. Enterprise-Wide Deployment >
          • A. Enterprise-wide view
          • B. Leadership
        • II. Organizational Process Management and Measures >
          • A. Impact on stakeholders
          • B. Critical to x (CTx) requirements
          • C. Benchmarking
          • D. Business performance measures
          • E. Financial measures
        • IV. Define >
          • A. Voice of the customer
          • B. Project charter
          • C. Project tracking
        • V. Measure >
          • D. Basic statistics
      • ASQ Six Sigma Black Belt Exam
      • ASQ Six Sigma Green Belt Exam
  • Six Sigma Materials
    • The Problem Solving Strategy Y = f(x) in Lean Six Sigma
    • Value Stream Mapping Explained
    • Pareto Analysis And Pareto Chart Explained
    • Best 5 Free Online Degree Programs In 2017
    • Cost Of Poor Quality (COPQ) Explained
    • Best 4 Free Online Certifications To Boost Your Resume
    • Pareto Analysis and Pareto Chart
    • Why Six Sigma Certification?
    • Six Sigma Green Belt Training
    • General History of Six Sigma & Continuous Improvement
    • Walter Shewhart Biography
    • Basic Lean Six Sigma Metrics
    • How to Make a Histogram
    • Statistical Process Control Charts
    • Lean Six Sigma Term Glossary
    • Kaizen and Kaizen Blitz
    • Central Limit Theorem
    • Six Sigma Symbols
    • Six Sigma Tables >
      • Z Score Tables
      • T Distribution Table
      • Chi-Square Distribution Table
      • F Distribution Table
      • Poisson Distribution Table
      • Cumulative Poisson Distribution Table
    • Six Sigma Diagrams >
      • Choosing a Right Parametric Test
      • Choosing a Right Control Chart
      • Commonly Used Lean Six Sigma Flowchart Symbols
      • Ishikawa (Fishbone) Diagram
      • Histogram
      • Scatterplot
      • Check Sheet
      • Failure Mode and Effects Analysis (FMEA)
    • Lean Six Sigma Belt Roles and Responsibilities
    • 5S
    • How to get six sigma certified?
    • International Six Sigma Certification Association (IASSC) Exam Reference Document
    • Useful Websites and Tools
    • 10 Best Free Udemy Courses That You Can Take Online
    • 5 Best Udemy Courses You Can Take Today
    • The Complete Web Developer Course 2.0 You Can Take Online | Udemy
    • 12 Best Probability and Statistics Online Courses and Classes [2018 Guide]
    • 15 Best Data Science Degrees, Courses and Certifications [2018]
  • Six Sigma Glossary
    • 5 Whys
    • Analytical and Descriptive Statistics
    • Brainstorming
    • Cost Of Quality
    • Design for Six Sigma (DFSS)
    • Efficiency of Estimators
    • Process Maps and Flow Charts
    • Gap Analysis
    • Common & Special Cause Variation
    • Quality Function Deployment (QFD)
    • In Control Process
    • Interest-Based Bargaining
    • Internal Customer
    • ISO9000
    • Kaizen Blitz
    • Kanban
    • Kano Model
    • Key Performance Indicators (KPI)
    • Lean Production
    • Management Strategies
    • MANOVA
    • Multivariate Analysis
    • Pareto Charts
    • Pareto Principle
    • PEST Analysis
    • Porter's Five Forces Analysis
    • Factor Analysis
    • Procedures
    • Process
    • Project Charter
    • Project Sponsor
    • Pull Production System
    • QS9000
    • Random Sampling
    • Failure Mode & Effects Analysis (FMEA)
    • Rolled Throughput Yield
    • Root Cause Analysis
    • Scenario Planning
    • Seven Quality Tools
    • SIPOC Diagrams
    • Six Sigma
    • SWOT Analysis
    • Systematic Sampling
    • System (Quality System)
    • Team Tools
    • Theory of Constraints
    • Throughput
    • Total Productive Maintenance (TPM)
    • Touch Time
    • Value Stream Maps
    • Visual Factory
    • Work In Progress (WIP)
    • Work In Queue
    • Work Instructions
    • Big Y
    • Control Plan
    • Waste
    • Evolutionary Operation of Processes (EVOP)
    • Cause & Effect Diagrams
    • 5C
    • 5Z
    • Project Selection
    • 8D Process
    • Appraisal Cost
    • Audit
    • Baseline
    • Business Process Quality Management
    • Check Sheet
    • Unintended Consequences
    • Voice Of The Customer (VOC)
    • Critical to Customer (CTC)
    • Critical To Quality (CTQ)
    • Customer Focus
    • Efficiency
    • Empowerment
    • Entry Criteria
    • Exit Criteria
    • Voice Of The Process (VOP)
    • Just In Time (JIT) Manufacturing
    • KISS
    • DMAIC
  • Six Sigma Blog
  • Forum
  • About Me
  • Privacy Policy
  • Contact
  • Top Free Online Courses With Printable Certificates
  • Roman Numerals Chart

PEST Analysis

Home/Body of Knowledge/PEST Analysis
All topics

PEST analysis is a strategic-planning tool for scanning the macro-environment: the Political, Economic, Social and Technological forces outside an organization that it cannot control but must respond to. Listing each factor and its likely impact shows which opportunities and threats to plan for. Extended versions add Legal and Environmental factors (PESTLE).

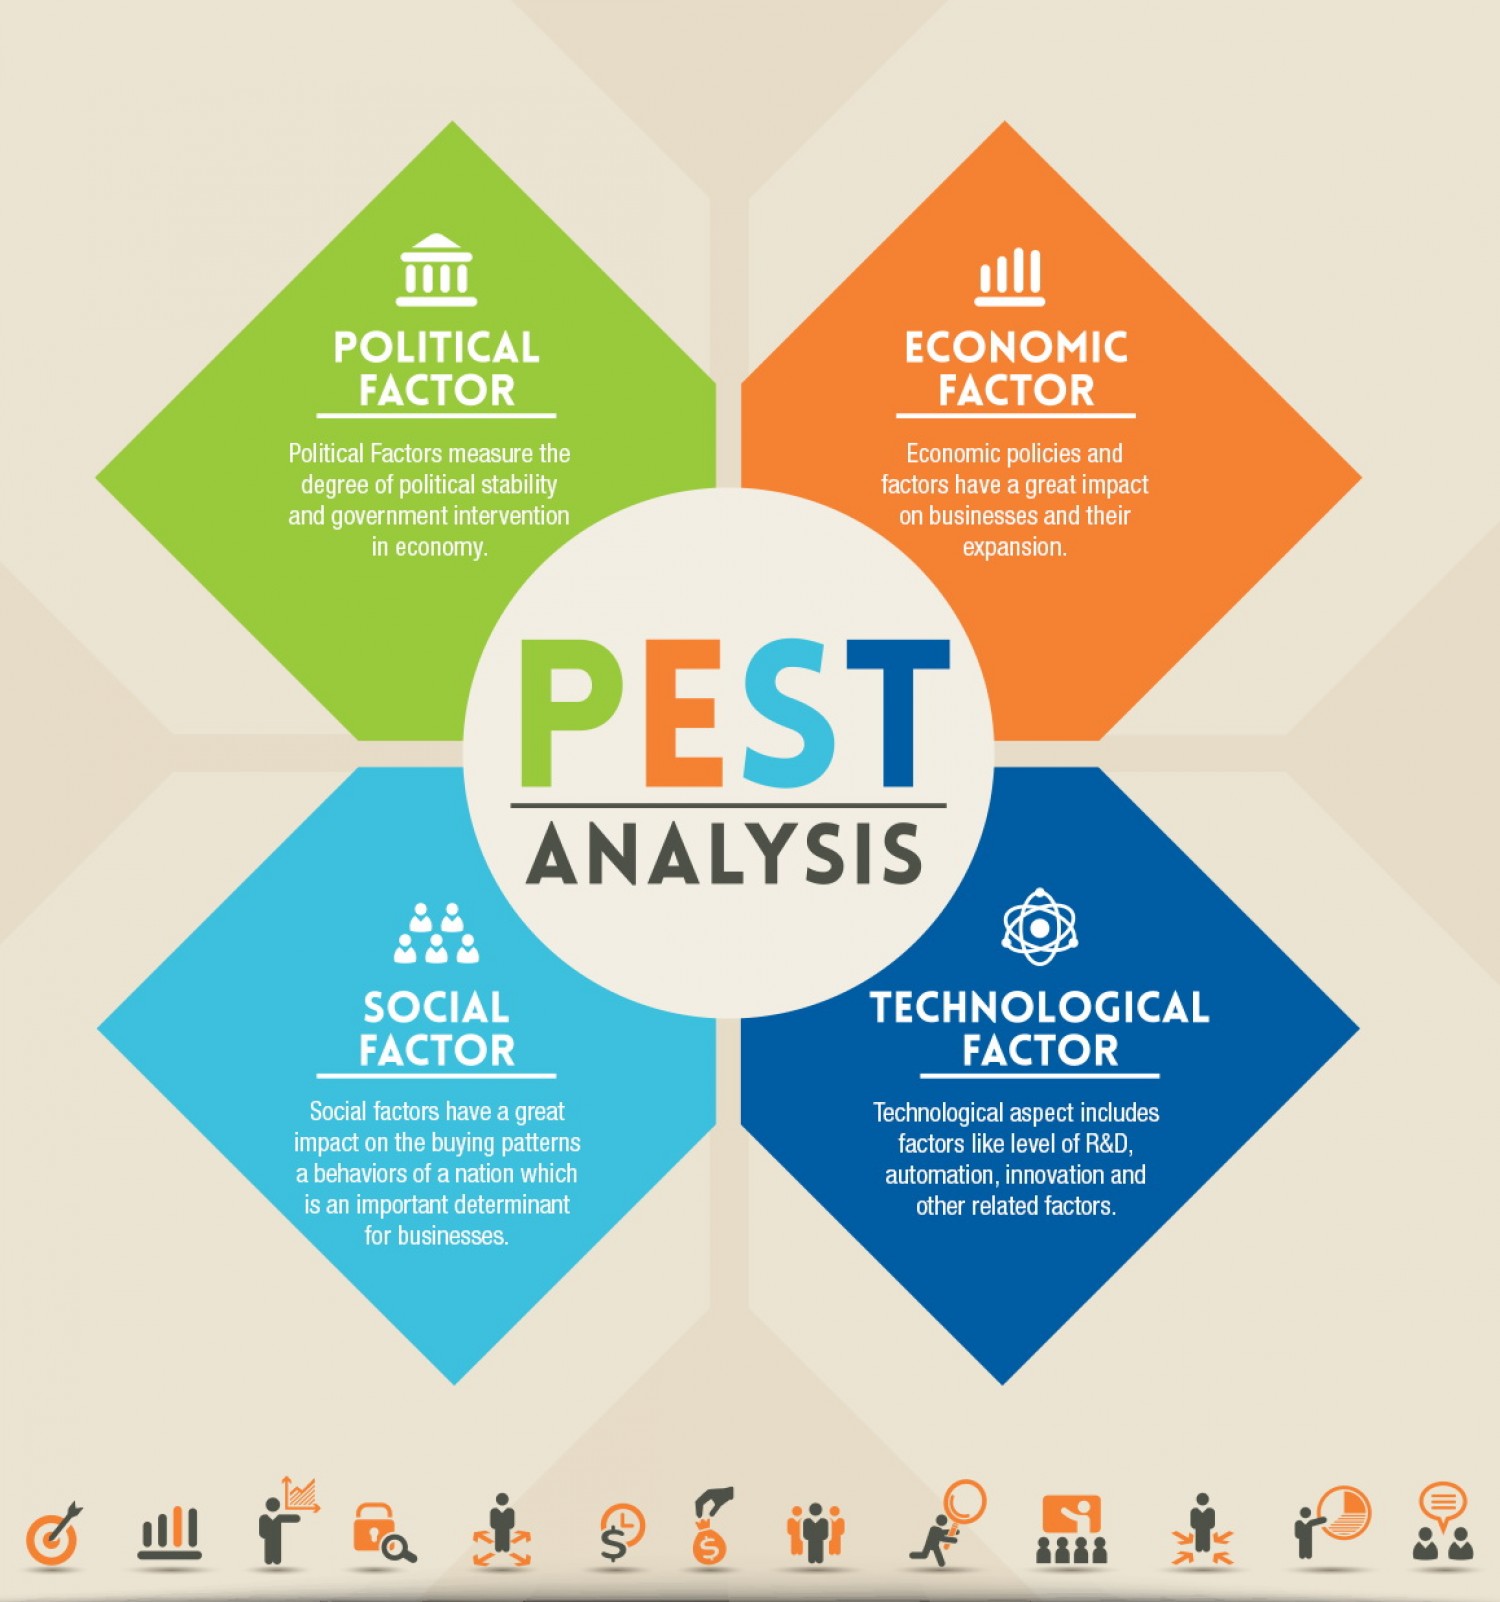
The PEST analysis is one strategy to analyze the macro-environment in which your company operates. In concept it is very similar to Porter’s five forces and to the SWOT analysis, and it includes four different perspectives:

  • Political analysis includes trading agreements, taxation and economic policies, and political stability, among others.
  • Economic analysis includes employment levels, GDP, economic trends and interest rates, among others.
  • Social analysis includes demographic, cultural and religious factors, among others.
  • Technological analysis includes the effects of technology on marketing and distribution, manufacturing cost, product quality and innovation, among others.
The four PEST factors around an organization Four boxes surround the organization. Political: trade agreements, tax policy, government stability, regulation. Economic: interest and exchange rates, inflation and growth, employment and wages, customer spending. Social: demographics, culture and lifestyle, education and skills, attitudes. Technological: automation, new materials and processes, digital channels, rate of innovation. PEST analysis: four outside forces the organization cannot control P · Political • Trade agreements, tariffs • Tax policy • Government stability • Regulation enforcement E · Economic • Interest and exchange rates • Inflation, GDP growth • Employment and wages • Customer spending S · Social • Demographics, age profile • Culture and lifestyle • Education, skills • Attitudes to health, quality T · Technological • Automation, AI • New materials, processes • Digital channels • Rate of innovation Your organization
The four PEST factors, with examples of what to look at under each.

Where does PEST analysis come from?

Francis J. Aguilar of Harvard Business School is usually credited with the idea: he described an early form, ETPS (economic, technical, political and social), in his 1967 book Scanning the Business Environment. The letters were later rearranged into PEST, and other variants added more headings. The idea has stayed the same: look systematically outside the organization before setting strategy.

VariantFactorsWhen to use it
PESTPolitical, Economic, Social, TechnologicalA quick first scan
PESTLE / PESTELPEST plus Legal and EnvironmentalRegulated sectors or where climate, waste and energy rules matter
STEEP / STEEPLESocial, Technological, Economic, Environmental, Political (plus Legal and Ethical)Long-range planning and scenario work

How do you do a PEST analysis?

  1. Set the scope. Decide what you are analyzing (the whole company, one product line, one market) and the time horizon, for example the next three years.
  2. Brainstorm factors under each heading. Use a cross-functional group and the prompts in the diagram. Brainstorming rules apply: list first, judge later.
  3. Gather evidence. Back each factor with a source: government statistics, central-bank forecasts, industry reports, regulator announcements, customer research. Remove anything that is only an opinion.
  4. Rate impact and likelihood. For each factor, note whether it is an opportunity or a threat and score its impact and likelihood (for example 1–5).
  5. Pick the few that matter. Rank by impact × likelihood. The top few usually feed straight into the opportunities and threats of a SWOT.
  6. Decide actions and owners. Turn each priority factor into a response, a monitoring indicator and an owner, then review the analysis at least once a year or when conditions change.

PEST analysis template and example

Copy the layout below into a spreadsheet or a whiteboard. The example rows are illustrative, for a hypothetical mid-sized manufacturer of plastic packaging; they are not data about a real company.

FactorExample findingOpportunity or threatImpact (1–5)Likelihood (1–5)Response
PoliticalNew tariffs proposed on imported resinThreat43Qualify a second, domestic supplier
EconomicHigher interest rates slow customers’ capital spendingThreat34Offer leasing of tooling; cut lead time to win share
SocialConsumers prefer recyclable packagingOpportunity54Launch a recyclable product line
TechnologicalVision systems make 100% automated inspection affordableOpportunity44Pilot automated inspection on the highest-defect line

In the example, the social and technological factors score highest (5 × 4 = 20 and 4 × 4 = 16), so they would be the first items carried into the SWOT and the strategic plan.

How does PEST analysis fit Lean Six Sigma?

Six Sigma projects should support the organization’s strategy. PEST is one of the tools used before projects are chosen: it helps leaders see which outside changes will affect customers and costs, so project selection targets the problems that matter most. A technology factor might start an automation project; a social factor such as changing customer expectations might start a voice of the customer study. It sits alongside the other strategic-planning tools in this guide: SWOT, Porter’s five forces, gap analysis, scenario planning and benchmarking, and with hoshin kanri for deploying the resulting goals.

PEST versus SWOT

PEST looks only outward, at forces in the wider environment. SWOT covers internal strengths and weaknesses as well as external opportunities and threats. Many teams do PEST first and use its results to fill the opportunities and threats part of the SWOT. Porter’s five forces looks at the industry level in between: rivals, buyers, suppliers, new entrants and substitutes.

Limitations

  • It is a snapshot; the environment keeps changing, so a PEST analysis goes out of date.
  • Lists can grow long without priorities. Always rate and rank the factors.
  • Factors overlap (a tax change is political and economic). Put each one where it is most useful and move on.
  • It depends on the quality of the information behind it; unsupported assumptions lead to poor decisions.
PEST Analysis

Sources and further reading

Further reading: CIPD: PESTLE analysis. Origin reference: Francis J. Aguilar, Scanning the Business Environment (1967).

Frequently asked questions

What does PEST stand for?

PEST stands for Political, Economic, Social and Technological, the four groups of outside factors that can affect an organization.

What is the difference between PEST and PESTLE?

PESTLE adds Legal and Environmental factors to the four PEST headings. It is useful when regulation or environmental issues have a big effect on the business.

Is PEST analysis internal or external?

External. PEST looks only at the macro-environment outside the organization; internal strengths and weaknesses are covered by a SWOT analysis.

When should you do a PEST analysis?

Before strategic planning, entering a new market, launching a product or selecting improvement projects, and again when major outside conditions change.

See also: SWOT analysis, Porter’s five forces, scenario planning, management strategies, and benchmarking.

All topics

Other strategic-planning tools covered in this guide: the enterprise-wide view.

Related guides

  • ASQ free training guide
  • Free Lean Six Sigma training guide
  • Training guide home

Last updated: November 14, 2026 · Published by Lean Six Sigma Training Guide (sixsigmatrainingfree.com) · How this guide is written