
Lean Six Sigma Training Guide
  • IASSC Free Training Guide
  • Free Lean Six Sigma Training Guide
  • ASQ Free Training Guide
  • Body of Knowledge
  • Practice Exams
    • Six Sigma Quick Training Tests >
      • Lean Six Sigma Practice Test 1
      • Lean Six Sigma Practice Test 2
      • Lean Six Sigma Practice Test 3
      • Lean Six Sigma Practice Test 4
      • Lean Six Sigma Practice Test 5
      • Lean Six Sigma Practice Test 6
      • Lean Six Sigma Practice Test 7
      • Lean Six Sigma Practice Test 8
      • Lean Six Sigma Practice Test 9
      • Lean Six Sigma Practice Test 10
      • Lean Six Sigma Practice Test 11
      • Lean Six Sigma Practice Test 12
    • Six Sigma DMAIC Training Tests >
      • DEFINE Six Sigma Training Test
      • MEASURE Six Sigma Training Test
      • ANALYZE Six Sigma Training Test
      • IMPROVE Six Sigma Training Test
      • CONTROL Six Sigma Training Test
    • IASSC, ASQ and Other Exams >
      • IASSC Six Sigma Black Belt Exam
      • IASSC Six Sigma Green Belt Exam
      • IASSC Six Sigma Yellow Belt Exam
      • Lean Six Sigma Exams By Topic >
        • I. Enterprise-Wide Deployment >
          • A. Enterprise-wide view
          • B. Leadership
        • II. Organizational Process Management and Measures >
          • A. Impact on stakeholders
          • B. Critical to x (CTx) requirements
          • C. Benchmarking
          • D. Business performance measures
          • E. Financial measures
        • IV. Define >
          • A. Voice of the customer
          • B. Project charter
          • C. Project tracking
        • V. Measure >
          • D. Basic statistics
      • ASQ Six Sigma Black Belt Exam
      • ASQ Six Sigma Green Belt Exam
  • Six Sigma Materials
    • The Problem Solving Strategy Y = f(x) in Lean Six Sigma
    • Value Stream Mapping Explained
    • Pareto Analysis And Pareto Chart Explained
    • Best 5 Free Online Degree Programs In 2017
    • Cost Of Poor Quality (COPQ) Explained
    • Best 4 Free Online Certifications To Boost Your Resume
    • Pareto Analysis and Pareto Chart
    • Why Six Sigma Certification?
    • Six Sigma Green Belt Training
    • General History of Six Sigma & Continuous Improvement
    • Walter Shewhart Biography
    • Basic Lean Six Sigma Metrics
    • How to Make a Histogram
    • Statistical Process Control Charts
    • Lean Six Sigma Term Glossary
    • Kaizen and Kaizen Blitz
    • Central Limit Theorem
    • Six Sigma Symbols
    • Six Sigma Tables >
      • Z Score Tables
      • T Distribution Table
      • Chi-Square Distribution Table
      • F Distribution Table
      • Poisson Distribution Table
      • Cumulative Poisson Distribution Table
    • Six Sigma Diagrams >
      • Choosing a Right Parametric Test
      • Choosing a Right Control Chart
      • Commonly Used Lean Six Sigma Flowchart Symbols
      • Ishikawa (Fishbone) Diagram
      • Histogram
      • Scatterplot
      • Check Sheet
      • Failure Mode and Effects Analysis (FMEA)
    • Lean Six Sigma Belt Roles and Responsibilities
    • 5S
    • How to get six sigma certified?
    • International Six Sigma Certification Association (IASSC) Exam Reference Document
    • Useful Websites and Tools
    • 10 Best Free Udemy Courses That You Can Take Online
    • 5 Best Udemy Courses You Can Take Today
    • The Complete Web Developer Course 2.0 You Can Take Online | Udemy
    • 12 Best Probability and Statistics Online Courses and Classes [2018 Guide]
    • 15 Best Data Science Degrees, Courses and Certifications [2018]
  • Six Sigma Glossary
    • 5 Whys
    • Analytical and Descriptive Statistics
    • Brainstorming
    • Cost Of Quality
    • Design for Six Sigma (DFSS)
    • Efficiency of Estimators
    • Process Maps and Flow Charts
    • Gap Analysis
    • Common & Special Cause Variation
    • Quality Function Deployment (QFD)
    • In Control Process
    • Interest-Based Bargaining
    • Internal Customer
    • ISO9000
    • Kaizen Blitz
    • Kanban
    • Kano Model
    • Key Performance Indicators (KPI)
    • Lean Production
    • Management Strategies
    • MANOVA
    • Multivariate Analysis
    • Pareto Charts
    • Pareto Principle
    • PEST Analysis
    • Porter's Five Forces Analysis
    • Factor Analysis
    • Procedures
    • Process
    • Project Charter
    • Project Sponsor
    • Pull Production System
    • QS9000
    • Random Sampling
    • Failure Mode & Effects Analysis (FMEA)
    • Rolled Throughput Yield
    • Root Cause Analysis
    • Scenario Planning
    • Seven Quality Tools
    • SIPOC Diagrams
    • Six Sigma
    • SWOT Analysis
    • Systematic Sampling
    • System (Quality System)
    • Team Tools
    • Theory of Constraints
    • Throughput
    • Total Productive Maintenance (TPM)
    • Touch Time
    • Value Stream Maps
    • Visual Factory
    • Work In Progress (WIP)
    • Work In Queue
    • Work Instructions
    • Big Y
    • Control Plan
    • Waste
    • Evolutionary Operation of Processes (EVOP)
    • Cause & Effect Diagrams
    • 5C
    • 5Z
    • Project Selection
    • 8D Process
    • Appraisal Cost
    • Audit
    • Baseline
    • Business Process Quality Management
    • Check Sheet
    • Unintended Consequences
    • Voice Of The Customer (VOC)
    • Critical to Customer (CTC)
    • Critical To Quality (CTQ)
    • Customer Focus
    • Efficiency
    • Empowerment
    • Entry Criteria
    • Exit Criteria
    • Voice Of The Process (VOP)
    • Just In Time (JIT) Manufacturing
    • KISS
    • DMAIC
  • Six Sigma Blog
  • Forum
  • About Me
  • Privacy Policy
  • Contact
  • Top Free Online Courses With Printable Certificates
  • Roman Numerals Chart

Common and Special Cause Variation

Home/Body of Knowledge/Common and Special Cause Variation
All topics

Common cause variation is the natural, built-in variation of a process: many small causes acting all the time, giving a stable and predictable pattern. Special cause variation (also called assignable cause) comes from a specific, identifiable event that is not part of the normal process, such as a broken tool, a bad batch of material, or a new operator. Control charts are designed to tell the two apart, because they need opposite responses: special causes are found and removed locally, while common-cause variation only goes down when the system itself is changed, which usually needs management action.

Common cause noise with one special cause spike A control chart where most points wander randomly inside the control limits, which is common cause variation. One point jumps above the upper control limit, labeled special cause, for example a bad material lot. UCL LCL special cause (e.g. bad material lot) everything else: common cause variation — the system’s normal noise Original diagram, illustrative data.

Common versus special cause

Common causeSpecial cause
Other namesChance, random, natural, generalAssignable
SourceMany small factors that are always presentA specific event or change
On a control chartRandom points inside the control limitsPoints outside the limits or non-random patterns
Who fixes itManagement, by changing the system (for example, upgrading a machine)Usually the people closest to the process (for example, fixing a machine fault or rejecting a bad lot)
ExamplesNormal wear, small temperature swings, normal differences between trained operatorsA broken tool, a wrong setting, a new untrained operator, a bad raw-material lot

The cost of mixing them up

Treating common-cause noise as if it were special — adjusting the process after every result — is called tampering, and it makes variation worse, not better. W. Edwards Deming demonstrated this with his funnel experiment. The opposite mistake is ignoring a real special cause. The control chart, first developed by Walter Shewhart, gives a rule for when to act and when to leave the process alone.
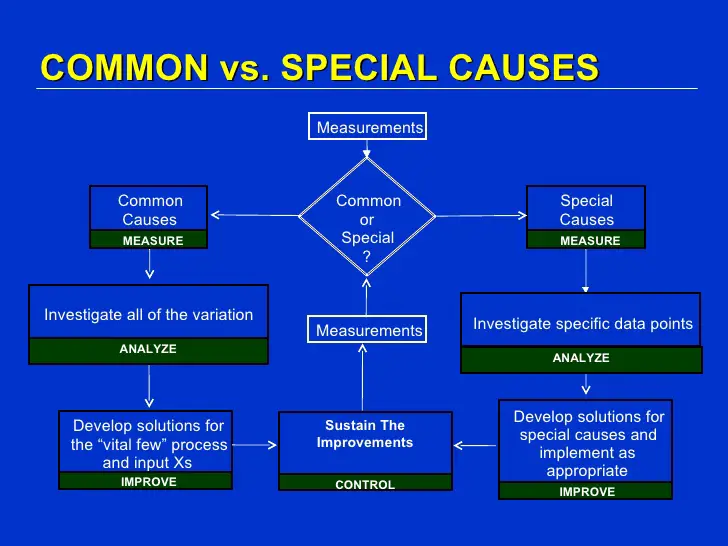
Common cause and special cause variation

Frequently asked questions

Is common cause variation always acceptable?

No. It is predictable, but it can still be too large for the customer’s specification. Reducing it is a typical Six Sigma project, and it needs changes to the process itself.

Who named common and special causes?

Walter Shewhart used the terms chance causes and assignable causes. W. Edwards Deming later popularized the names common causes and special causes.

See also: in-control process, voice of the process, and control charts.

All topics

See also: Process capability · Multi-vari chart: three families of variation

Related guides

  • ASQ free training guide
  • Free Lean Six Sigma training guide
  • Training guide home

Last updated: November 14, 2026 · Published by Lean Six Sigma Training Guide (sixsigmatrainingfree.com) · How this guide is written