
Rolled Throughput Yield
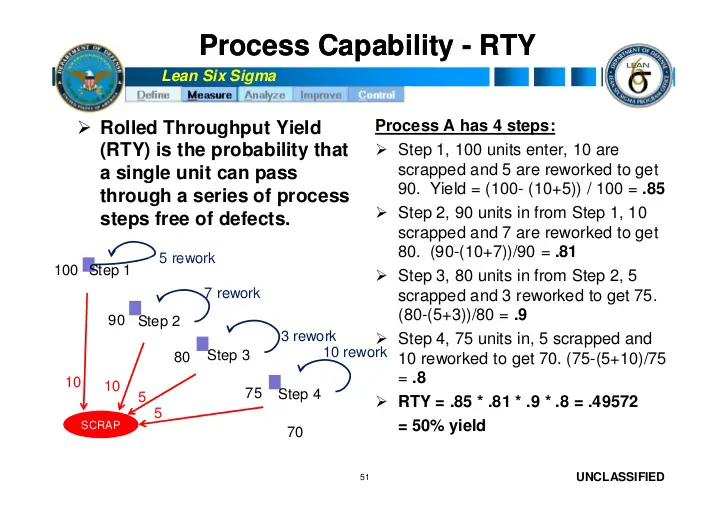
The Rolled Throughput Yield (RTY) is a term that is used in Six Sigma and it refers to the probability of a certain unit to pass through an entire process without any defect.
While the First Time Field (FTY) only considers the inputs that enter in the process and the outputs of the process, the Rolled Throughput Yield also considers the rework.
The RTY is sensitive to defects. What this means is that instead of basing itself on the yield on produced units, it bases itself on the number of defects that are found during the entire process. So, whenever there is a stage that produces defects, the yield for this stage will be below 100%. And even if the defect is corrected at a later stage, the yield for this step will remain the same.
One of the most powerful operational metrics that you can use is the Rolled Throughput Yield (RTY).
The Rolled Throughput Yield or RTY assesses the true yield of a specific process and this may include what we usually call "hidden factory" that affects so many companies and organizations.
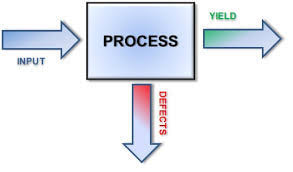
The Rolled Throughput Yield or RTY is the probability of passing all in-process criteria for each step in a process as well as all end process criteria. RTY is defect sensitive which means that instead of being based on the yield on produced units, it uses the number of defects found at each process step.
When a process step produces defects, the yield for that step will be less than 100 percent. Even if the defective outputs are corrected (a separate process step), the yield for this step is unchanged.
The Rolled Throughput Yield or RTY assesses the true yield of a specific process and this may include what we usually call "hidden factory" that affects so many companies and organizations.
The Rolled Throughput Yield or RTY is the probability of passing all in-process criteria for each step in a process as well as all end process criteria. RTY is defect sensitive which means that instead of being based on the yield on produced units, it uses the number of defects found at each process step.
When a process step produces defects, the yield for that step will be less than 100 percent. Even if the defective outputs are corrected (a separate process step), the yield for this step is unchanged.
The Difference Between The Traditional Yield And The Rolled Throughput Yield (RTY)
The truth is that there are still many business owners who don't quite understand the RTY meaning. So, we believe that the best way we can show you how the RTY works is to show you the difference between it and the traditional yield. So, let's check a simple example.
Let's assume that we are talking about a company that continues to use the traditional yield approach.
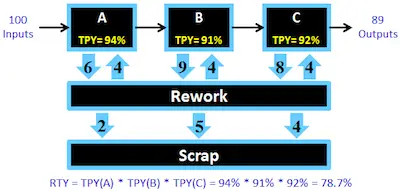
Imagine that there is a manufacturing process that includes 3 different processes - processes A, B, and C. Let's imagine that on a specific day, they had the following performance:
Let's assume that we are talking about a company that continues to use the traditional yield approach.
Imagine that there is a manufacturing process that includes 3 different processes - processes A, B, and C. Let's imagine that on a specific day, they had the following performance:
- Process A: 100 parts passed through this process and 84 “good” parts left this process (scrapped 16).
- Process B: With some WIP laying around 110 parts passed through this process with 82 “good” parts passing (28 scrapped).
- Process C: With even more WIP laying around this process they managed to produce 138 parts with 126 parts passing (12 scrapped).
When a company uses the traditional yield approach, it tends to only be concerned about what goes out of the door. So, as you can imagine, the manufacturing manager is only concerned with Process C. And since they had a great day (only scrapped 12 parts) they report a “yield” of 91% (126/138).
However, and while all the numbers match up, there are some flaws with this technique. The truth is that with this traditional yield, the company completely ignores all the scrapped parts in Processes A and B.
However, and while all the numbers match up, there are some flaws with this technique. The truth is that with this traditional yield, the company completely ignores all the scrapped parts in Processes A and B.
So, what if the company was using the Rolled Throughput Yield (RTY) methodology?
In case the company was using the Rolled Throughput Yield, then the manufacturing manager would need to take a closer look at processes A, B, and C.
If you check the data we displayed before, we can state that Process A had a daily yield of 84% (84/100) while Process B had a daily yield of 75% (82/110), and finally process C had a daily yield of 91% (126/138).
So, when you want to calculate the RTY, you will need to multiply these yields together giving us a composite yield for the day. Doing this gives you:
84% x 75% x 91% = 57%