Lean Six Sigma Training Guide
  • IASSC Free Training Guide
  • Free Lean Six Sigma Training Guide
  • ASQ Free Training Guide
  • Body of Knowledge
  • Practice Exams
    • Six Sigma Quick Training Tests >
      • Lean Six Sigma Practice Test 1
      • Lean Six Sigma Practice Test 2
      • Lean Six Sigma Practice Test 3
      • Lean Six Sigma Practice Test 4
      • Lean Six Sigma Practice Test 5
      • Lean Six Sigma Practice Test 6
      • Lean Six Sigma Practice Test 7
      • Lean Six Sigma Practice Test 8
      • Lean Six Sigma Practice Test 9
      • Lean Six Sigma Practice Test 10
      • Lean Six Sigma Practice Test 11
      • Lean Six Sigma Practice Test 12
    • Six Sigma DMAIC Training Tests >
      • DEFINE Six Sigma Training Test
      • MEASURE Six Sigma Training Test
      • ANALYZE Six Sigma Training Test
      • IMPROVE Six Sigma Training Test
      • CONTROL Six Sigma Training Test
    • IASSC, ASQ and Other Exams >
      • IASSC Six Sigma Black Belt Exam
      • IASSC Six Sigma Green Belt Exam
      • IASSC Six Sigma Yellow Belt Exam
      • Lean Six Sigma Exams By Topic >
        • I. Enterprise-Wide Deployment >
          • A. Enterprise-wide view
          • B. Leadership
        • II. Organizational Process Management and Measures >
          • A. Impact on stakeholders
          • B. Critical to x (CTx) requirements
          • C. Benchmarking
          • D. Business performance measures
          • E. Financial measures
        • IV. Define >
          • A. Voice of the customer
          • B. Project charter
          • C. Project tracking
        • V. Measure >
          • D. Basic statistics
      • ASQ Six Sigma Black Belt Exam
      • ASQ Six Sigma Green Belt Exam
  • Six Sigma Materials
    • The Problem Solving Strategy Y = f(x) in Lean Six Sigma
    • Value Stream Mapping Explained
    • Pareto Analysis And Pareto Chart Explained
    • Best 5 Free Online Degree Programs In 2017
    • Cost Of Poor Quality (COPQ) Explained
    • Best 4 Free Online Certifications To Boost Your Resume
    • Pareto Analysis and Pareto Chart
    • Why Six Sigma Certification?
    • Six Sigma Green Belt Training
    • General History of Six Sigma & Continuous Improvement
    • Walter Shewhart Biography
    • Basic Lean Six Sigma Metrics
    • How to Make a Histogram
    • Statistical Process Control Charts
    • Lean Six Sigma Term Glossary
    • Kaizen and Kaizen Blitz
    • Central Limit Theorem
    • Six Sigma Symbols
    • Six Sigma Tables >
      • Z Score Tables
      • T Distribution Table
      • Chi-Square Distribution Table
      • F Distribution Table
      • Poisson Distribution Table
      • Cumulative Poisson Distribution Table
    • Six Sigma Diagrams >
      • Choosing a Right Parametric Test
      • Choosing a Right Control Chart
      • Commonly Used Lean Six Sigma Flowchart Symbols
      • Ishikawa (Fishbone) Diagram
      • Histogram
      • Scatterplot
      • Check Sheet
      • Failure Mode and Effects Analysis (FMEA)
    • Lean Six Sigma Belt Roles and Responsibilities
    • 5S
    • How to get six sigma certified?
    • International Six Sigma Certification Association (IASSC) Exam Reference Document
    • Useful Websites and Tools
    • 10 Best Free Udemy Courses That You Can Take Online
    • 5 Best Udemy Courses You Can Take Today
    • The Complete Web Developer Course 2.0 You Can Take Online | Udemy
    • 12 Best Probability and Statistics Online Courses and Classes [2018 Guide]
    • 15 Best Data Science Degrees, Courses and Certifications [2018]
  • Six Sigma Glossary
    • 5 Whys
    • Analytical and Descriptive Statistics
    • Brainstorming
    • Cost Of Quality
    • Design for Six Sigma (DFSS)
    • Efficiency of Estimators
    • Process Maps and Flow Charts
    • Gap Analysis
    • Common & Special Cause Variation
    • Quality Function Deployment (QFD)
    • In Control Process
    • Interest-Based Bargaining
    • Internal Customer
    • ISO9000
    • Kaizen Blitz
    • Kanban
    • Kano Model
    • Key Performance Indicators (KPI)
    • Lean Production
    • Management Strategies
    • MANOVA
    • Multivariate Analysis
    • Pareto Charts
    • Pareto Principle
    • PEST Analysis
    • Porter's Five Forces Analysis
    • Factor Analysis
    • Procedures
    • Process
    • Project Charter
    • Project Sponsor
    • Pull Production System
    • QS9000
    • Random Sampling
    • Failure Mode & Effects Analysis (FMEA)
    • Rolled Throughput Yield
    • Root Cause Analysis
    • Scenario Planning
    • Seven Quality Tools
    • SIPOC Diagrams
    • Six Sigma
    • SWOT Analysis
    • Systematic Sampling
    • System (Quality System)
    • Team Tools
    • Theory of Constraints
    • Throughput
    • Total Productive Maintenance (TPM)
    • Touch Time
    • Value Stream Maps
    • Visual Factory
    • Work In Progress (WIP)
    • Work In Queue
    • Work Instructions
    • Big Y
    • Control Plan
    • Waste
    • Evolutionary Operation of Processes (EVOP)
    • Cause & Effect Diagrams
    • 5C
    • 5Z
    • Project Selection
    • 8D Process
    • Appraisal Cost
    • Audit
    • Baseline
    • Business Process Quality Management
    • Check Sheet
    • Unintended Consequences
    • Voice Of The Customer (VOC)
    • Critical to Customer (CTC)
    • Critical To Quality (CTQ)
    • Customer Focus
    • Efficiency
    • Empowerment
    • Entry Criteria
    • Exit Criteria
    • Voice Of The Process (VOP)
    • Just In Time (JIT) Manufacturing
    • KISS
    • DMAIC
  • Six Sigma Blog
  • Forum
  • About Me
  • Privacy Policy
  • Contact
  • Top Free Online Courses With Printable Certificates
  • Roman Numerals Chart

Lean Six Sigma Flowchart Symbols

Tweet
Home/Body of Knowledge/Flowchart symbols
Previous: Process maps and flow chartsAll topicsNext: Voice of the customer

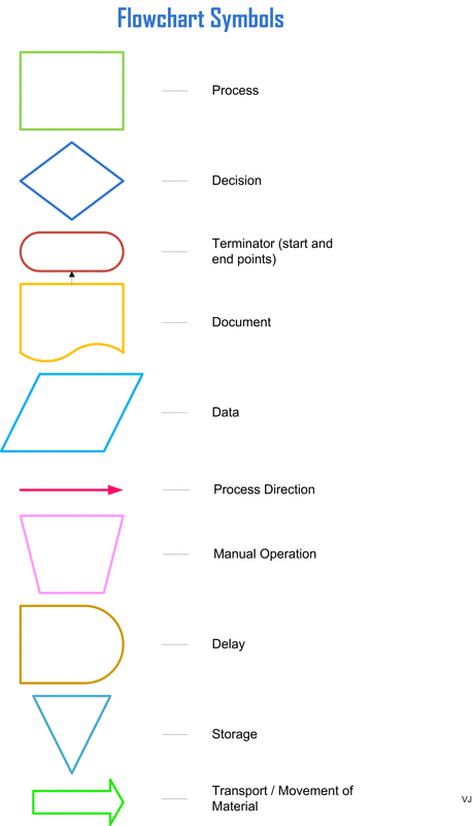
The core flowchart symbols are: an oval (terminator) for start and end, a rectangle for a process step, a diamond for a decision, a parallelogram for input or output, a wavy-bottom rectangle for a document, a circle for a connector, and arrows for the direction of flow. These shapes follow the conventions in ISO 5807:1985 (and the older ANSI flowchart standard). Lean Six Sigma process maps add a few more, such as delay and manual operation.

The eight most-used flowchart symbols Eight shapes with labels: oval terminator, rectangle process, diamond decision, parallelogram input or output, document with wavy bottom, circle connector, D-shaped delay, and trapezoid manual operation. Flowchart symbols you will see on most process maps Terminatorstart / end Processan action or step Decisionyes / no branch Input / outputdata in or out Documentform, report Connectorjump on same page Delaywaiting, queue Manual operationdone by hand
Original diagram. Arrows (flow lines) connect the shapes and show the order of steps.

Flowchart symbols and their meanings

SymbolNameUse it for
Oval / rounded rectangleTerminatorStart and end of the process
RectangleProcessAny action or step
DiamondDecisionA question with two or more exits (yes/no, pass/fail)
ParallelogramInput / outputData or material entering or leaving the process
Rectangle with wavy baseDocumentA printed or electronic document, form, or report
Rectangle with double side barsPredefined processA sub-process mapped elsewhere
Small circleConnectorJoins flow lines on the same page
Pentagon (home plate)Off-page connectorContinues the flow on another page
D shapeDelayWaiting time or a queue — useful for spotting waste
TrapezoidManual operationA step done by hand, not by a system
CylinderStored data / databaseData held in a system
ArrowFlow lineDirection from one step to the next

Tips for Lean Six Sigma process maps

  • Use one start and at least one end; every decision needs a labeled exit for each answer.
  • Map the process as it really runs today before drawing the improved version.
  • Mark delays and rework loops clearly; they are often where the waste is.
  • For a higher-level view, start with a SIPOC; for flow and lead time, use a value stream map; see also process maps and flow charts.

Frequently asked questions

What does a diamond mean in a flowchart?

A decision. The process branches depending on the answer, so each exit arrow should be labeled, for example “Yes” and “No”.

What is the standard for flowchart symbols?

ISO 5807:1985 sets the symbols and conventions for flowcharts, building on the earlier ANSI flowchart standard. Most software uses the same basic shapes.

Ability to map processes is important for any quality improvement undertaking including lean six sigma projects. Business process flow charting is a handy technique often used by lean six sigma professionals to determine how exactly processes flow and what needs to be fixed. Most lean six sigma certification exams are likely to include questions on business process mapping and test black, green and yellow belt certification seekers on this important subject. 

The diagram below shows business process flowchart symbols. It will help lean six sigma black belt, green belt and yellow belt certification seekers learn the meaning of flowcharts symbols often used in lean six sigma projects.
See also:
  • Choosing a Right Parametric Test
  • Choosing a Right Control Chart
  • Z Table
  • T Distribution Table
  • Pareto Chart and Analysis
  • About Six Sigma Certification
flow chart symbols six sigma

See also: Six Sigma symbols (6 and σ) · Six Sigma diagrams · Process maps and flow charts

Related guides

  • Attribute MSA (agreement analysis)
  • ANOVA and non-parametric tests
  • Correlation and regression
  • Normality and data transformation
  • Sample size and sampling
  • Statistical distributions
  • ASQ free training guide
  • Free Lean Six Sigma training guide
Previous: Process maps and flow chartsAll topicsNext: Voice of the customer

Last updated: November 11, 2026 · Published by Lean Six Sigma Training Guide (sixsigmatrainingfree.com) · How this guide is written