Lean Six Sigma Training Guide Copy
  • IASSC Free Training Guide
  • Free Lean Six Sigma Training Guide
  • ASQ Free Training Guide
  • Practice Exams
    • Six Sigma Quick Training Tests >
      • Lean Six Sigma Practice Test 1
      • Lean Six Sigma Practice Test 2
      • Lean Six Sigma Practice Test 3
      • Lean Six Sigma Practice Test 4
      • Lean Six Sigma Practice Test 5
      • Lean Six Sigma Practice Test 6
      • Lean Six Sigma Practice Test 7
      • Lean Six Sigma Practice Test 8
      • Lean Six Sigma Practice Test 9
      • Lean Six Sigma Practice Test 10
      • Lean Six Sigma Practice Test 11
      • Lean Six Sigma Practice Test 12
    • Six Sigma DMAIC Training Tests >
      • DEFINE Six Sigma Training Test
      • MEASURE Six Sigma Training Test
      • ANALYZE Six Sigma Training Test
      • IMPROVE Six Sigma Training Test
      • CONTROL Six Sigma Training Test
    • IASSC, ASQ and Other Exams >
      • IASSC Six Sigma Black Belt Exam
      • IASSC Six Sigma Green Belt Exam
      • IASSC Six Sigma Yellow Belt Exam
      • Lean Six Sigma Exams By Topic >
        • I. Enterprise-Wide Deployment >
          • A. Enterprise-wide view
          • B. Leadership
        • II. Organizational Process Management and Measures >
          • A. Impact on stakeholders
          • B. Critical to x (CTx) requirements
          • C. Benchmarking
          • D. Business performance measures
          • E. Financial measures
        • IV. Define >
          • A. Voice of the customer
          • B. Project charter
          • C. Project tracking
        • V. Measure >
          • D. Basic statistics
      • ASQ Six Sigma Black Belt Exam
      • ASQ Six Sigma Green Belt Exam
  • Six Sigma Materials
    • The Problem Solving Strategy Y = f(x) in Lean Six Sigma
    • Value Stream Mapping Explained
    • Pareto Analysis And Pareto Chart Explained
    • Best 5 Free Online Degree Programs In 2017
    • Cost Of Poor Quality (COPQ) Explained
    • Best 4 Free Online Certifications To Boost Your Resume
    • Pareto Analysis and Pareto Chart
    • Why Six Sigma Certification?
    • Six Sigma Green Belt Training
    • General History of Six Sigma & Continuous Improvement
    • Walter Shewhart Biography
    • Basic Lean Six Sigma Metrics
    • How to Make a Histogram
    • Statistical Process Control Charts
    • Lean Six Sigma Term Glossary
    • Kaizen and Kaizen Blitz
    • Central Limit Theorem
    • Six Sigma Symbols
    • Six Sigma Tables >
      • Z Score Tables
      • T Distribution Table
      • Chi-Square Distribution Table
      • F Distribution Table
      • Poisson Distribution Table
      • Cumulative Poisson Distribution Table
    • Six Sigma Diagrams >
      • Choosing a Right Parametric Test
      • Choosing a Right Control Chart
      • Commonly Used Lean Six Sigma Flowchart Symbols
      • ​Ishikawa (Fishbone) Diagram
      • Histogram
      • Scatterplot
      • Check Sheet
      • Failure Mode and Effects Analysis (FMEA)
    • Lean Six Sigma Belt Roles and Responsibilities
    • 5S
    • How to get six sigma certified?
    • International Six Sigma Certification Association (IASSC) Exam Reference Document
    • Useful Websites and Tools
    • 10 Best Free Udemy Courses That You Can Take Online
    • 5 Best Udemy Courses You Can Take Today
    • The Complete Web Developer Course 2.0 You Can Take Online | Udemy
    • 12 Best Probability and Statistics Online Courses and Classes [2018 Guide]
    • 15 Best Data Science Degrees, Courses and Certifications [2018]
  • Six Sigma Glossary
    • 5 Whys
    • Analytical and Descriptive Statistics
    • Brainstorming
    • Cost Of Quality
    • Design for Six Sigma (DFSS)
    • Efficiency of Estimators
    • Process Maps and Flow Charts
    • Gap Analysis
    • Common & Special Cause Variation
    • Quality Function Deployment (QFD)
    • In Control Process
    • Interest-Based Bargaining
    • Internal Customer
    • ISO9000
    • Kaizen Blitz
    • Kanban
    • Kano Model
    • Key Performance Indicators (KPI)
    • Lean Production
    • Management Strategies
    • MANOVA
    • Multivariate Analysis
    • Pareto Charts
    • Pareto Principle
    • PEST Analysis
    • Porter's Five Forces Analysis
    • Factor Analysis
    • Procedures
    • Process
    • Project Charter
    • Project Sponsor
    • Pull Production System
    • QS9000
    • Random Sampling
    • Failure Mode & Effects Analysis (FMEA)
    • Rolled Throughput Yield
    • Root Cause Analysis
    • Scenario Planning
    • Seven Quality Tools
    • SIPOC Diagrams
    • Six Sigma
    • SWOT Analysis
    • Systematic Sampling
    • System (Quality System)
    • Team Tools
    • Theory of Constraints
    • Throughput
    • Total Productive Maintenance (TPM)
    • Touch Time
    • Value Stream Maps
    • Visual Factory
    • Work In Progress (WIP)
    • Work In Queue
    • Work Instructions
    • Big Y
    • Control Plan
    • Waste
    • Evolutionary Operation of Processes (EVOP)
    • Cause & Effect Diagrams
    • 5C
    • 5Z
    • Project Selection
    • 8D Process
    • Appraisal Cost
    • Audit
    • Baseline
    • Business Process Quality Management
    • Check Sheet
    • Unintended Consequences
    • Voice Of The Customer (VOC)
    • Critical to Customer (CTC)
    • Critical To Quality (CTQ)
    • Customer Focus
    • Efficiency
    • Empowerment
    • Entry Criteria
    • Exit Criteria
    • Voice Of The Process (VOP)
    • Just In Time (JIT) Manufacturing
    • KISS
    • DMAIC
  • Six Sigma Blog
  • Forum
  • About Me
  • Privacy Policy
  • Contact
  • Top Free Online Courses With Printable Certificates
  • Roman Numerals Chart

General History of Six Sigma & Continuous Improvement

Tweet
Bill Smith Father of Six Sigma Motorola
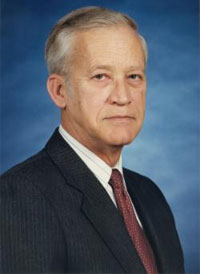
Six Sigma is a set of strategies, techniques, and tools for process improvement whose origin can be traced to Bill Smith, an engineer who worked for Motorola. He is often referred to as the “Father of Six Sigma”. After graduating from the US Naval Academy and the University of Minnesota School of Management he has worked almost 35 years in engineering and quality assurance.

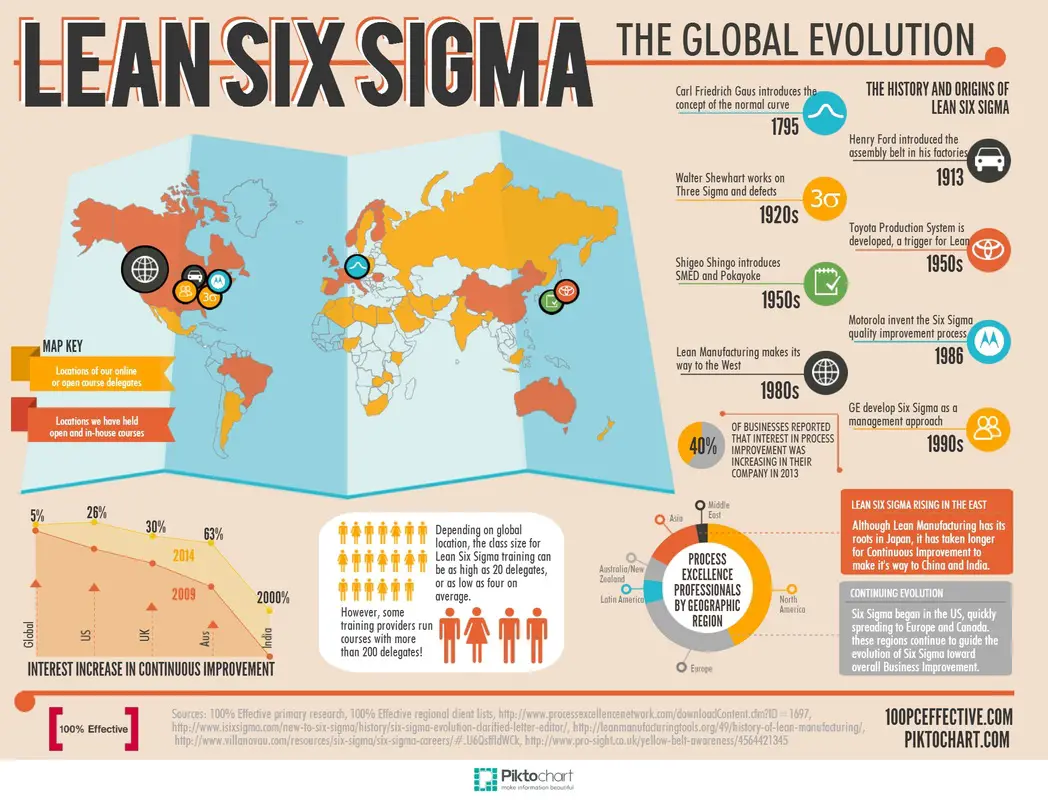
In 80’s he approached then Motorola’s CEO Bob Galvin and suggested to focus on defects caused by manufacturing process variation. Bill Smith believed that achieving drastic decrease in defects was possible by eliminating variation. This would result in less waste, increased savings and customer satisfaction. In 1987, Galvin launched a long term quality program, called “The Six Sigma Quality Program”. The program was a corporate program which established Six Sigma as the required capability level to approach the standard of 3.4 defects per million opportunities (DPMO). This new standard was to be used in everything: in products, processes, services and administration. Motorola achieved several billion dollars in savings as a result of Six Sigma approach.

Since Motorola’s successful introduction of Six Sigma system, many other global companies followed suit. In 1993, inspired by Motorola’s success, Larry Bossidy the CEO of Allied Signal decided to adopt Six Sigma system. Shortly after, Jack Welch, then Chairman and CEO of General Electric introduced this innovative quality management system to his company. Currently many global companies use Six Sigma for quality management and improvement. Just to name few: Intel, Honeywell, Toshiba, Vodafone, Samsung Group, Bank of America and Chevron.

Even though Six Sigma system gained prominence in 80’s, its cornerstone concept of statistical quality control can be traced to Walter Shewhart and Edward Deming in the first half of the XX’s century.
Walter Shewhart Control Charts Six Sigma

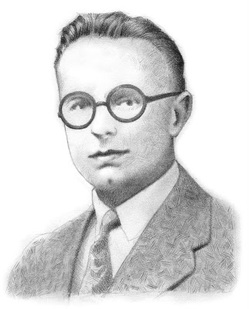
Walter Andrew Shewhart was a physicist, engineer and statistician often referred to as the father of statistical process control. After earning PH.D in Physics from University of California Berkley, he joined the Western Electric Company in 1918.  In order to assist Bell Telephone engineers avoid transmission equipment defects, Shewhart wrote a memorandum where he identified process variation as a main reason for causing defects. He also used control charts to demonstrate two key causes of variation: special-cause and chance-cause. Shewhart showed that keeping manufacturing process in control would drastically reduce variation.

Shewhart’s ideas were furthered by his student Edwards Deming who held Ph.D in mathematics and physics from Yale. Deming met Shewhart at Bell Telephone Laboratories in the late 1920s while studying at Yale. In 1939, Inspired by his mentor’s work Deming published a series of Shewhart’s lectures at USDA into a book - Statistical Method from the Viewpoint of Quality Control. The book helped spread the ideas of statistical process control and control charts

Read more:
  • What You Can Expect as a Six Sigma Black Belt Salary
  • About Six Sigma Certification
  • How Much It Costs to Take Six Sigma Certification Exam
  • Why Six Sigma Certification
  • Lean Six Sigma Belt Roles and Responsibilities
history of six sigma
Proudly powered by Weebly