Lean Six Sigma Training Guide Copy
  • IASSC Free Training Guide
  • Free Lean Six Sigma Training Guide
  • ASQ Free Training Guide
  • Practice Exams
    • Six Sigma Quick Training Tests >
      • Lean Six Sigma Practice Test 1
      • Lean Six Sigma Practice Test 2
      • Lean Six Sigma Practice Test 3
      • Lean Six Sigma Practice Test 4
      • Lean Six Sigma Practice Test 5
      • Lean Six Sigma Practice Test 6
      • Lean Six Sigma Practice Test 7
      • Lean Six Sigma Practice Test 8
      • Lean Six Sigma Practice Test 9
      • Lean Six Sigma Practice Test 10
      • Lean Six Sigma Practice Test 11
      • Lean Six Sigma Practice Test 12
    • Six Sigma DMAIC Training Tests >
      • DEFINE Six Sigma Training Test
      • MEASURE Six Sigma Training Test
      • ANALYZE Six Sigma Training Test
      • IMPROVE Six Sigma Training Test
      • CONTROL Six Sigma Training Test
    • IASSC, ASQ and Other Exams >
      • IASSC Six Sigma Black Belt Exam
      • IASSC Six Sigma Green Belt Exam
      • IASSC Six Sigma Yellow Belt Exam
      • Lean Six Sigma Exams By Topic >
        • I. Enterprise-Wide Deployment >
          • A. Enterprise-wide view
          • B. Leadership
        • II. Organizational Process Management and Measures >
          • A. Impact on stakeholders
          • B. Critical to x (CTx) requirements
          • C. Benchmarking
          • D. Business performance measures
          • E. Financial measures
        • IV. Define >
          • A. Voice of the customer
          • B. Project charter
          • C. Project tracking
        • V. Measure >
          • D. Basic statistics
      • ASQ Six Sigma Black Belt Exam
      • ASQ Six Sigma Green Belt Exam
  • Six Sigma Materials
    • The Problem Solving Strategy Y = f(x) in Lean Six Sigma
    • Value Stream Mapping Explained
    • Pareto Analysis And Pareto Chart Explained
    • Best 5 Free Online Degree Programs In 2017
    • Cost Of Poor Quality (COPQ) Explained
    • Best 4 Free Online Certifications To Boost Your Resume
    • Pareto Analysis and Pareto Chart
    • Why Six Sigma Certification?
    • Six Sigma Green Belt Training
    • General History of Six Sigma & Continuous Improvement
    • Walter Shewhart Biography
    • Basic Lean Six Sigma Metrics
    • How to Make a Histogram
    • Statistical Process Control Charts
    • Lean Six Sigma Term Glossary
    • Kaizen and Kaizen Blitz
    • Central Limit Theorem
    • Six Sigma Symbols
    • Six Sigma Tables >
      • Z Score Tables
      • T Distribution Table
      • Chi-Square Distribution Table
      • F Distribution Table
      • Poisson Distribution Table
      • Cumulative Poisson Distribution Table
    • Six Sigma Diagrams >
      • Choosing a Right Parametric Test
      • Choosing a Right Control Chart
      • Commonly Used Lean Six Sigma Flowchart Symbols
      • ​Ishikawa (Fishbone) Diagram
      • Histogram
      • Scatterplot
      • Check Sheet
      • Failure Mode and Effects Analysis (FMEA)
    • Lean Six Sigma Belt Roles and Responsibilities
    • 5S
    • How to get six sigma certified?
    • International Six Sigma Certification Association (IASSC) Exam Reference Document
    • Useful Websites and Tools
    • 10 Best Free Udemy Courses That You Can Take Online
    • 5 Best Udemy Courses You Can Take Today
    • The Complete Web Developer Course 2.0 You Can Take Online | Udemy
    • 12 Best Probability and Statistics Online Courses and Classes [2018 Guide]
    • 15 Best Data Science Degrees, Courses and Certifications [2018]
  • Six Sigma Glossary
    • 5 Whys
    • Analytical and Descriptive Statistics
    • Brainstorming
    • Cost Of Quality
    • Design for Six Sigma (DFSS)
    • Efficiency of Estimators
    • Process Maps and Flow Charts
    • Gap Analysis
    • Common & Special Cause Variation
    • Quality Function Deployment (QFD)
    • In Control Process
    • Interest-Based Bargaining
    • Internal Customer
    • ISO9000
    • Kaizen Blitz
    • Kanban
    • Kano Model
    • Key Performance Indicators (KPI)
    • Lean Production
    • Management Strategies
    • MANOVA
    • Multivariate Analysis
    • Pareto Charts
    • Pareto Principle
    • PEST Analysis
    • Porter's Five Forces Analysis
    • Factor Analysis
    • Procedures
    • Process
    • Project Charter
    • Project Sponsor
    • Pull Production System
    • QS9000
    • Random Sampling
    • Failure Mode & Effects Analysis (FMEA)
    • Rolled Throughput Yield
    • Root Cause Analysis
    • Scenario Planning
    • Seven Quality Tools
    • SIPOC Diagrams
    • Six Sigma
    • SWOT Analysis
    • Systematic Sampling
    • System (Quality System)
    • Team Tools
    • Theory of Constraints
    • Throughput
    • Total Productive Maintenance (TPM)
    • Touch Time
    • Value Stream Maps
    • Visual Factory
    • Work In Progress (WIP)
    • Work In Queue
    • Work Instructions
    • Big Y
    • Control Plan
    • Waste
    • Evolutionary Operation of Processes (EVOP)
    • Cause & Effect Diagrams
    • 5C
    • 5Z
    • Project Selection
    • 8D Process
    • Appraisal Cost
    • Audit
    • Baseline
    • Business Process Quality Management
    • Check Sheet
    • Unintended Consequences
    • Voice Of The Customer (VOC)
    • Critical to Customer (CTC)
    • Critical To Quality (CTQ)
    • Customer Focus
    • Efficiency
    • Empowerment
    • Entry Criteria
    • Exit Criteria
    • Voice Of The Process (VOP)
    • Just In Time (JIT) Manufacturing
    • KISS
    • DMAIC
  • Six Sigma Blog
  • Forum
  • About Me
  • Privacy Policy
  • Contact
  • Top Free Online Courses With Printable Certificates
  • Roman Numerals Chart

Pareto Principle

Pareto Principle
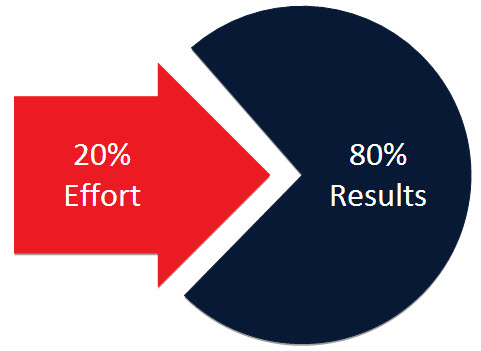
The Pareto Principle was first defined by Vilfredo Pareto, an Italian economist. At the time, he elaborated the principle to compare the wealth distribution. At the time, he concluded that 80% of the resources were owned by only 20% of the population. 

The Pareto Principle started to being used by the different organizations with the main goal of improving the processes. It's not uncommon to see that around 80% of the problems discovered during processes result from around 20% of the causes. 

Once the Pareto Principle is applied to the processes to establish the main causes of the problems, the results are later displayed as a histogram chart, the Pareto Chart. 
​

Proudly powered by Weebly